First of all, thank you very much to all of the members, for dealing with the topic of environment and sensor technology, as well as the public availability of the environment of data.
Looking to a solution to feed my smart home system (Openhab) something with external weather data, I also came across the sensor.community, and was also able to successfully integrate and display my preferred values, such as PM2.5.
I already have local data for temperature and humidity. But since today there was a larger article in the local newspaper about “particulate matter”, I started to look it up.
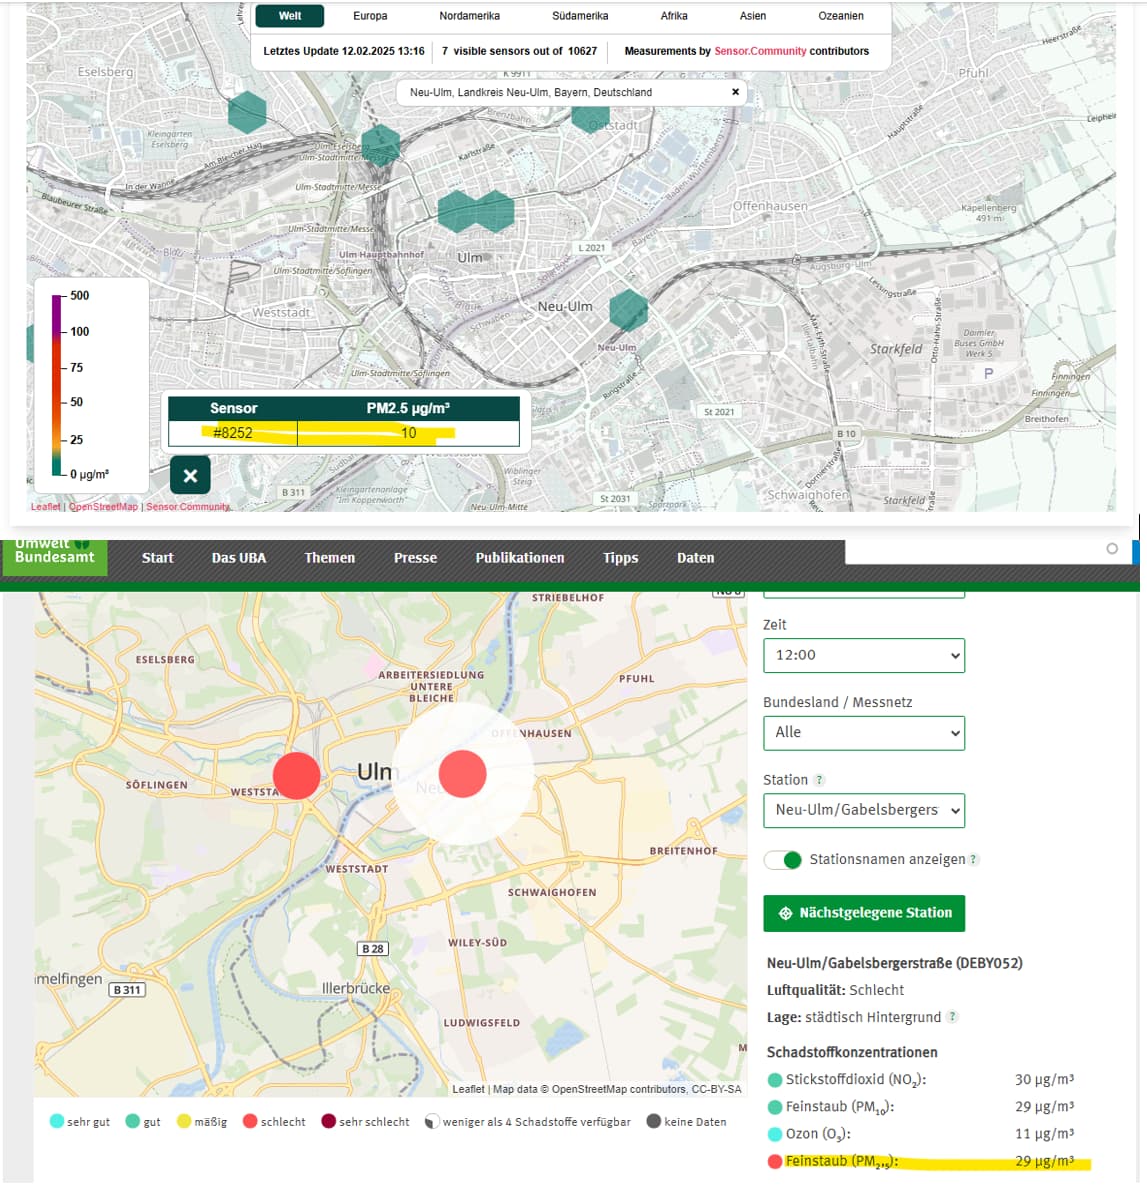
I noticed that a presumably the nearly same sensor, which is operated in my city, can be used by a factor of three shows other values (see attachment). Once at the Federal Environment Agency, and also the Sensor Community page. Who can now be believed more? The Federal Environment Agency, or the Sensor.Community If I now look at the values for the greater Munich or Stuttgart area, then I almost don’t believe that a large part of the sensors here “green values”.
So where can all those different values by factor three comming from. ANd we are not talking about an single value from a single station.
How can all this be, that community values and govermant values are so much different?
Thank you for your answers.
Welcome !
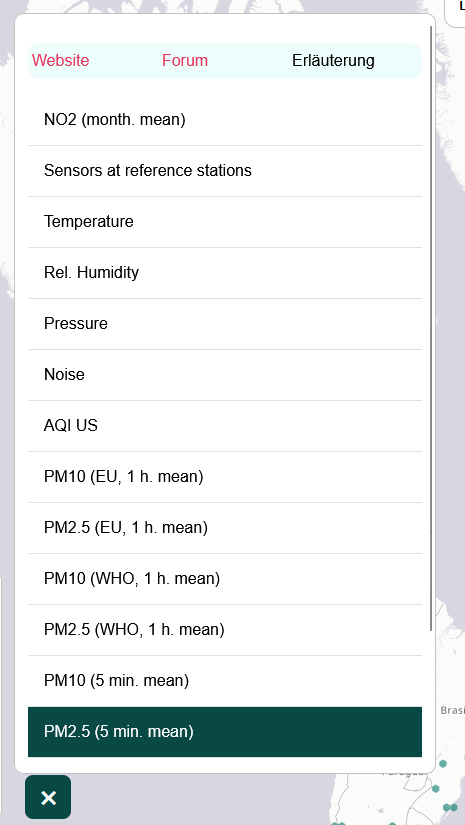
Have you try to show the 1 day mean on the map ?
SC sensors show the 5 min. mean. On which timespan are the official sensors values calculated ?
How to bring the sensor.community map to 1 day view?
The offical values are messured by 1h slots.
The pictures show exactly the two values at the same last messurement.
Please check by yourself in your local region in Germany via the offcial site:
Compare community sensors with official sensors
It is difficult to compare measurements of different sensors on simple values or points especially through raw measurements. The fact you find a factor 3 between the mentioned sensors is not surprising to me (it could also be sometimes more). However if you applied the right treatment of the data over a longer period you will realize that we can get an acceptable correlation between the official sensors and the community sensors; it is then useful for the community to rely on our SDS sensors to assess the evolution of the air quality where no official sensors are deployed.
To be better convinced by this philosophy you can refer to the post mentioned in reference where I specifically assessed the environment in Ulm based on the present sensors.
You could also check the methodology through the web site: https://www.deciphair.com
Sure, there is a difference between sensor in location A and location B, perhaps when their also only 100m far from each other. For temperature and humidity, I have my own inside and outside from the house and I use my smarthome to use them for actors. e.g. switch on and off the clima-system in case of change.
It is also not this important, if the temperature is one or two degrees more or less compared to other values I find by official sensors or other weather services in the internet.
Then I was thinking about finding a ready-to-go solution for my smarthome generate my own setup outside of the house. But to complicate here for the setup. Then I was checking for solution to get the value outside of the system and show it in the smarthome system.
And as said before I was wondering, why:
Sensors close to each other having this much difference
Sensory in different cities compared to each other have this much difference
And also, the complete e.g. map of Germany shows this much difference
So, I was wondering how this could be? 10-15% difference fine, no question about it.
But as checking different once in detail, I found this 3 x difference as samples here.
This was triggering me to ask about the reason for it.
Thanks for your return.
The community sensors have different responses between them. Thus, the calibration of their measurements is key.
Take several SDS sensors, put them at the same place and same orientation, and you will see that they provide different measurements sometimes with a factor 2; however they have the same dynamical behavior, what is fondamental to work in a network. So the first thing to do is to align the sensors on the same measurement reference value applying a gain coefficient on the outputs; this brings a good improvement in the sensors compared to official sensors.
The second difficulty is to compare sensors measurements in the same area (even with sensors within 100 m perimeter); in a town, sensors are either at ground level or at upper floor, close to the pollution source (ex street) or a few meters back to the source; this could lead to another factor of difference (2 to 3) (ex: putting sensors onto two different faces of a building may show a big difference). So you can not really compare measurements between sensors in a giving area on a map expecting a 10-15% difference.
So my approach is to adjust the outputs of sensors to a reference value in a given area which can be an official station. Then you can compare the evolutions on the different sensors, but do not expect an accuracy of 10%.
The interest of our community sensors is not to make pure science: it is illusory; this is useful to make trend analysis and thus to evaluate a global evolution.
When I see applications showing maps with various concentrations values based on raw data from citizen sensors, it is a joke !!! It means nearly nothing.
So keep simple, defining an humble objective to assess your air quality environment.
I have updated the analysis to correct some uncertainties. (see the associated reference post).
This confirms your first perception that between officials values and raw data of the community sensors, the difference may be by a factor 3 for PM2.5.
So a dedicated processing is needed to correctly use the measurements of the community sensors. But once it is done on a significant period and thanks to the fact that the sensors have a good repetitive dynamical behavior comparable to the official sensors, we can rely on their data with the adequate recurrent processing.