Compare community values with offical values
This post is in response to the referenced topic (previous post from another community member)
The raised problem to get different values between community sensors and official sensors is key and results from the different nature of these sensors.
An official sensor is quite costly due its construction and associated tests to validate it; so it has a high quality level, reliability and credibility. The community sensors are very low cost sensors built with rough components not fully tested and really sorted out and based a different measurement principle than the official sensors.
Consequently we shall expect some dispersion in the community sensors performances (between sensors themselves) with possible significant delta with official sensors. However the SDS sensors used by the community are surprisingly efficient assuming we apply the right approach in their use and treatment.
Several reasons may justify the delta between the community sensors and official sensors:
- performance dispersion between sensors, so the community sensors need a calibration.
- sensitivity to thermal environment (in particular low temperature and indirectly to humidity)
- position and orientation of a community sensor compared to the official sensor (distance, wind direction, thermal environment (heating…)…).
- …
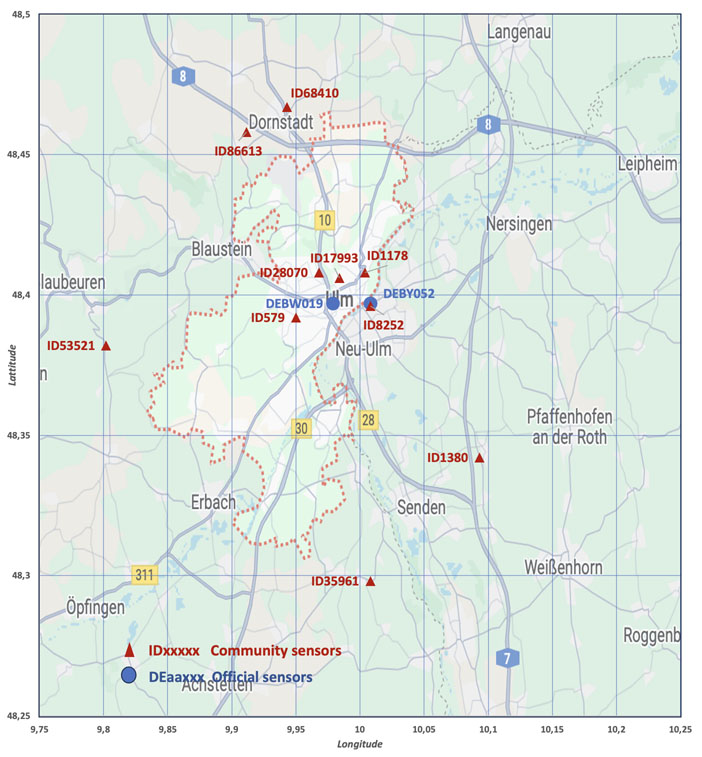
To illustrate these conditions the analysis of the sensors in the Ulm area (Germany) was performed involving the local official sensors (DEBW019 and DEBY052) and the community sensors in and around the town:
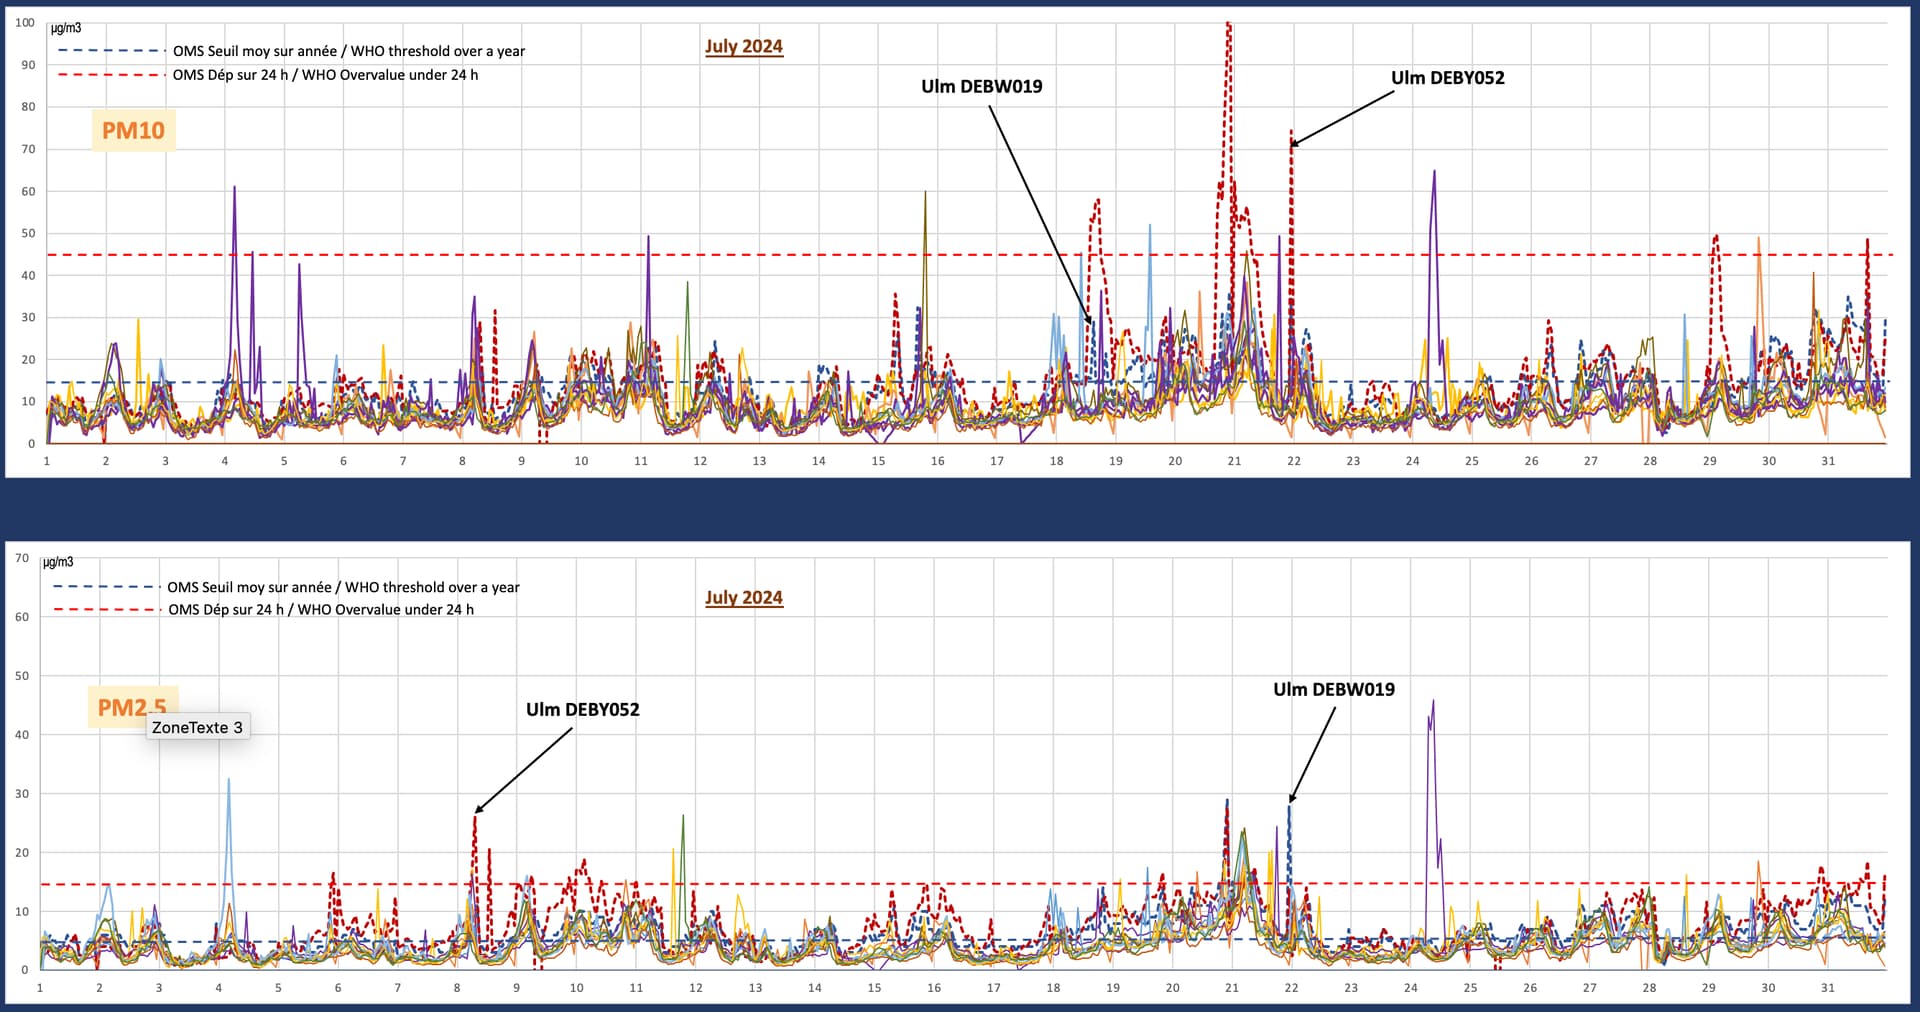
- First step: evaluation in summer to avoid potential thermal effect (medium temperature around 22 °C)
- in the present evaluation the community sensors are calibrated to minimize the dispersion between sensors
The response of the community sensors is quite good compared to the official sensors; these latter are showing some more prominent peaks in particular for DEBY052 which could be interesting to understand in the specific area of this sensor.
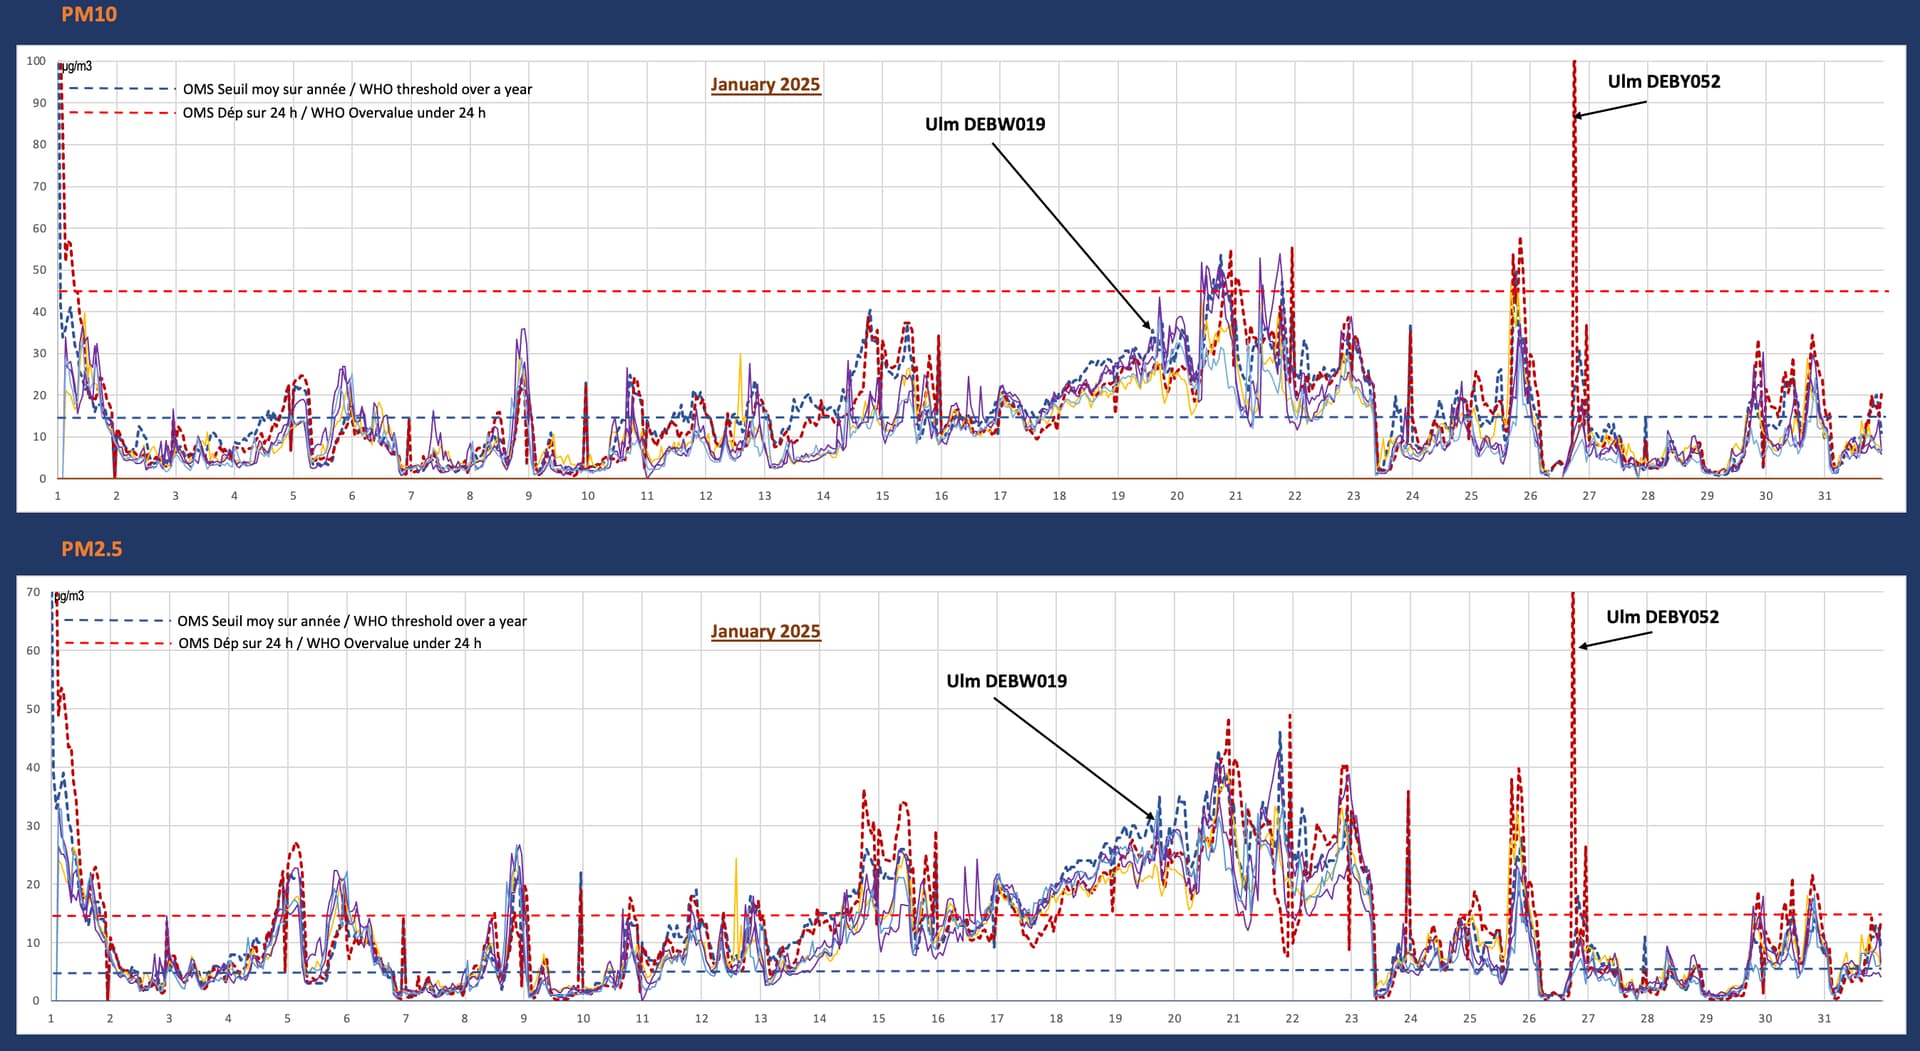
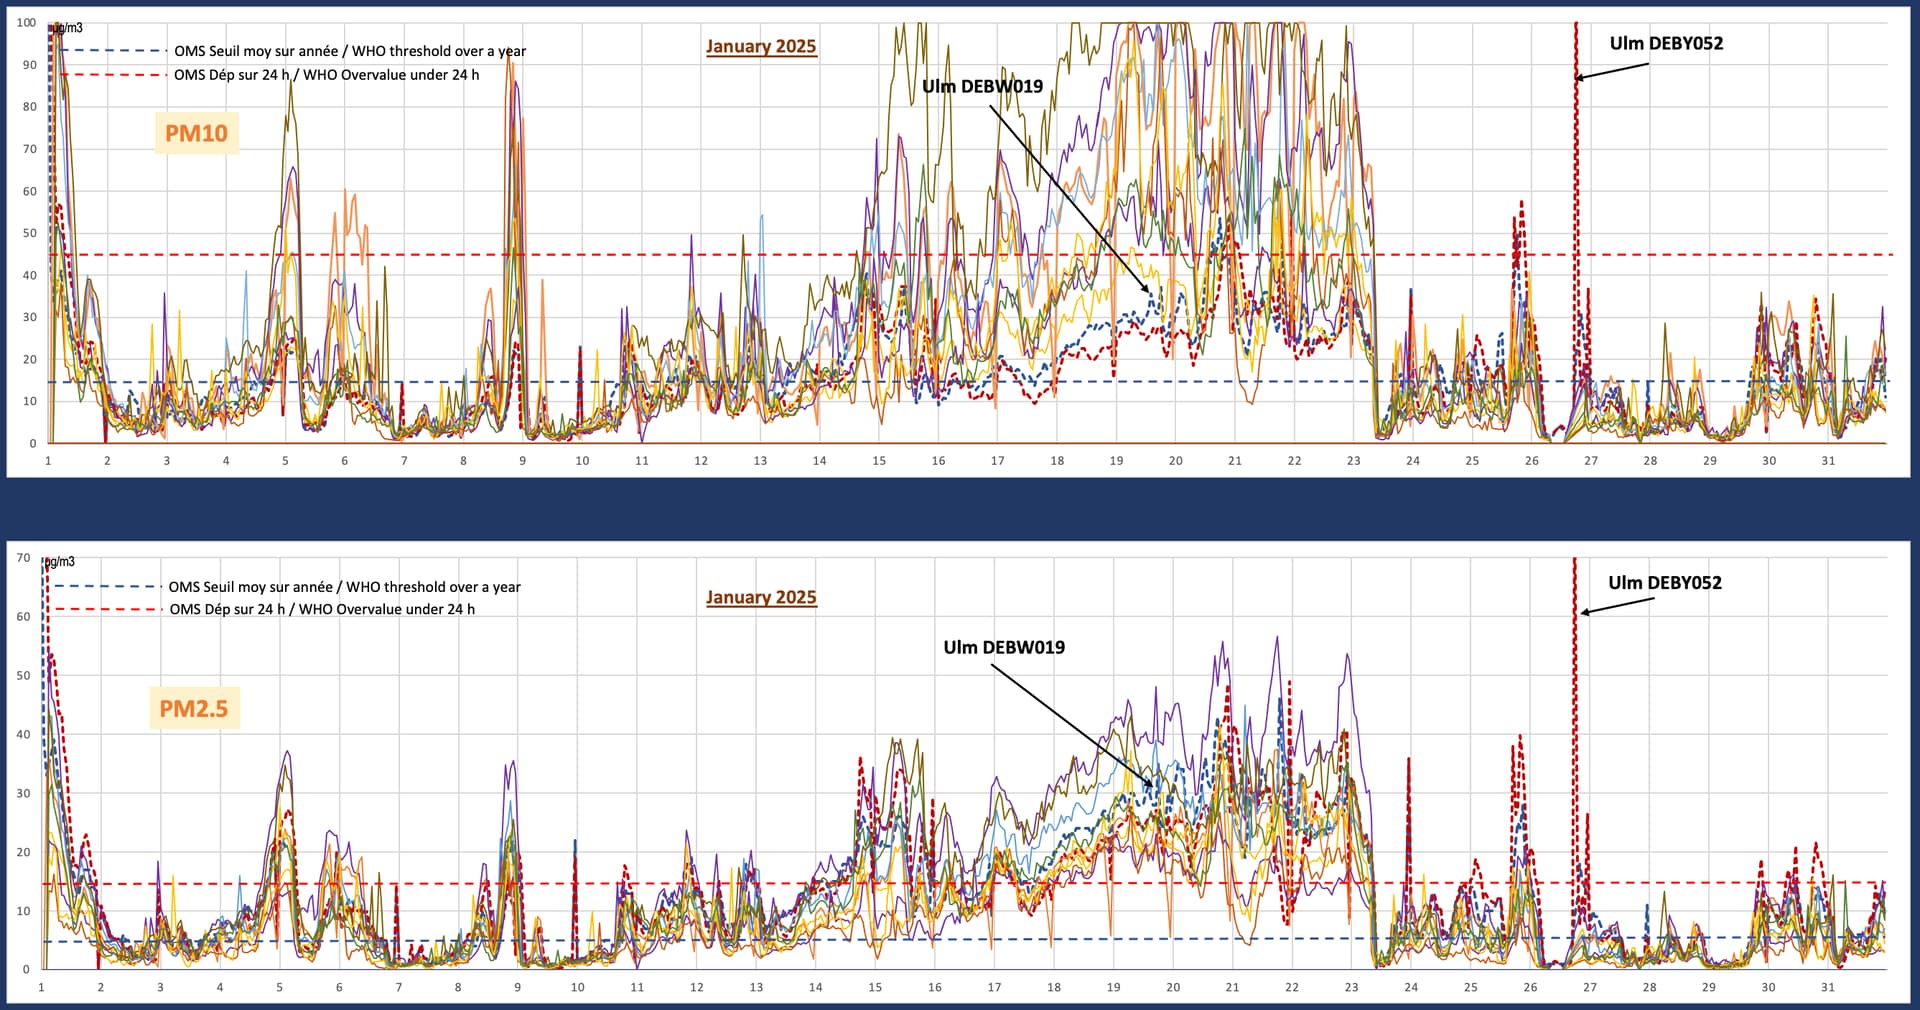
- Second step: evaluation in winter (January 2025)
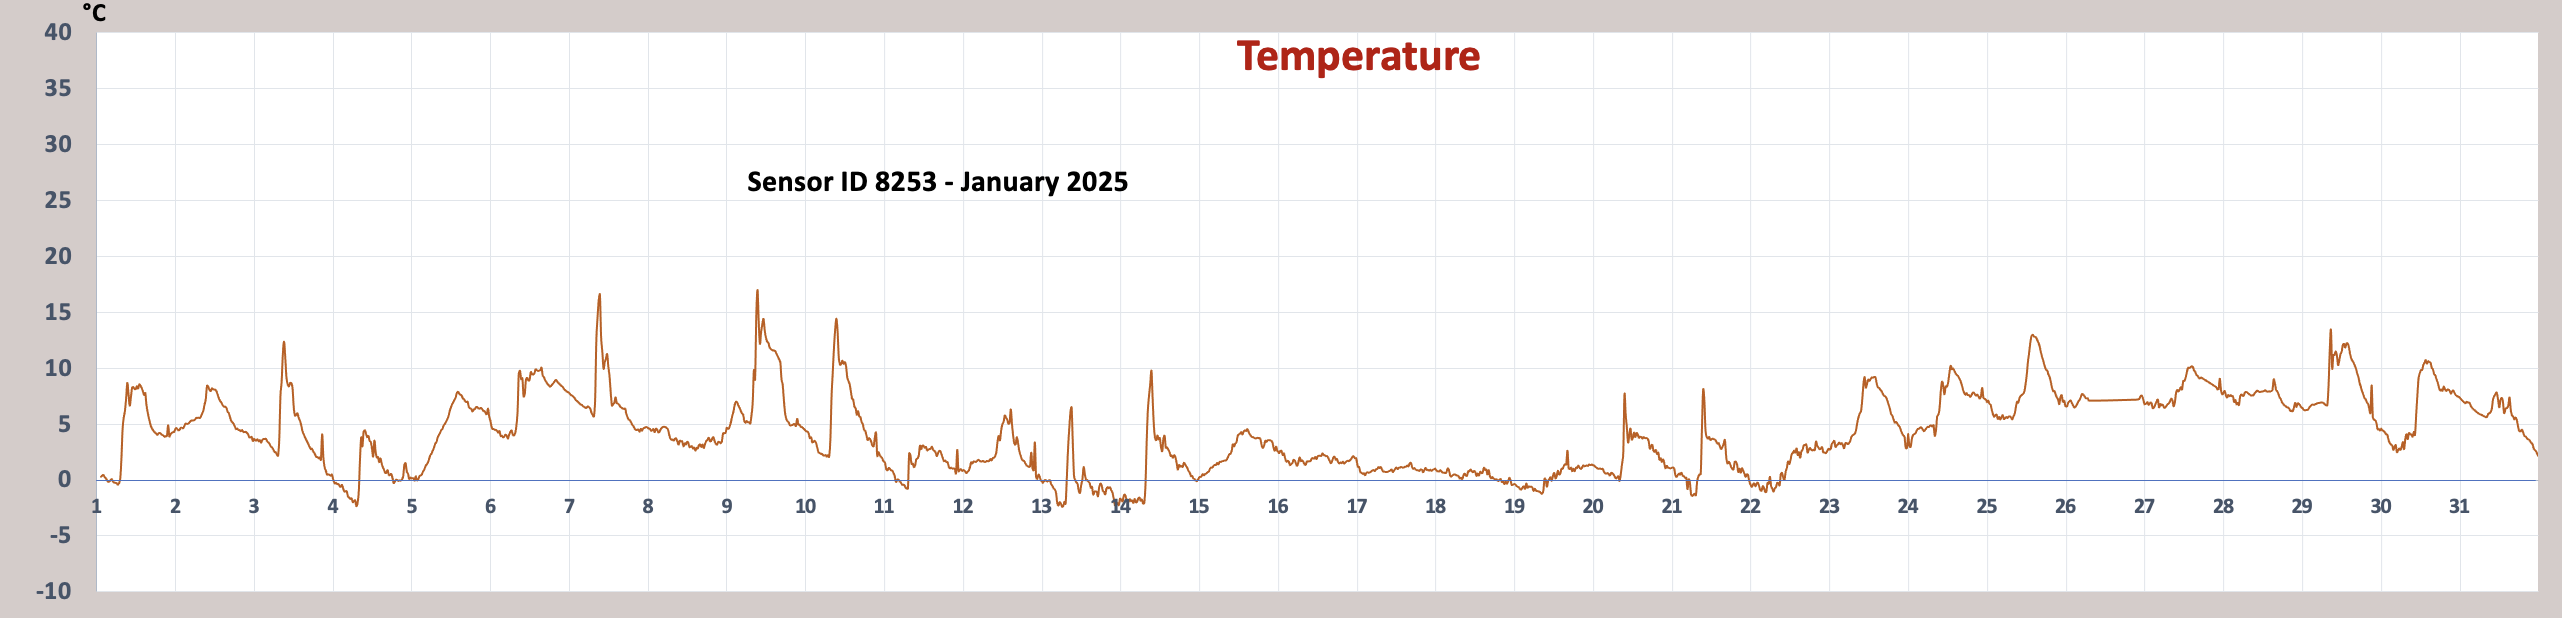
- with the same calibration as in the previous case the dispersion of the community sensors is enormous and results from the drift of the sensors in low temperature. The correlation of the disturbed measurements with the low temperature period between the 15th and 23rd in particular is evident.
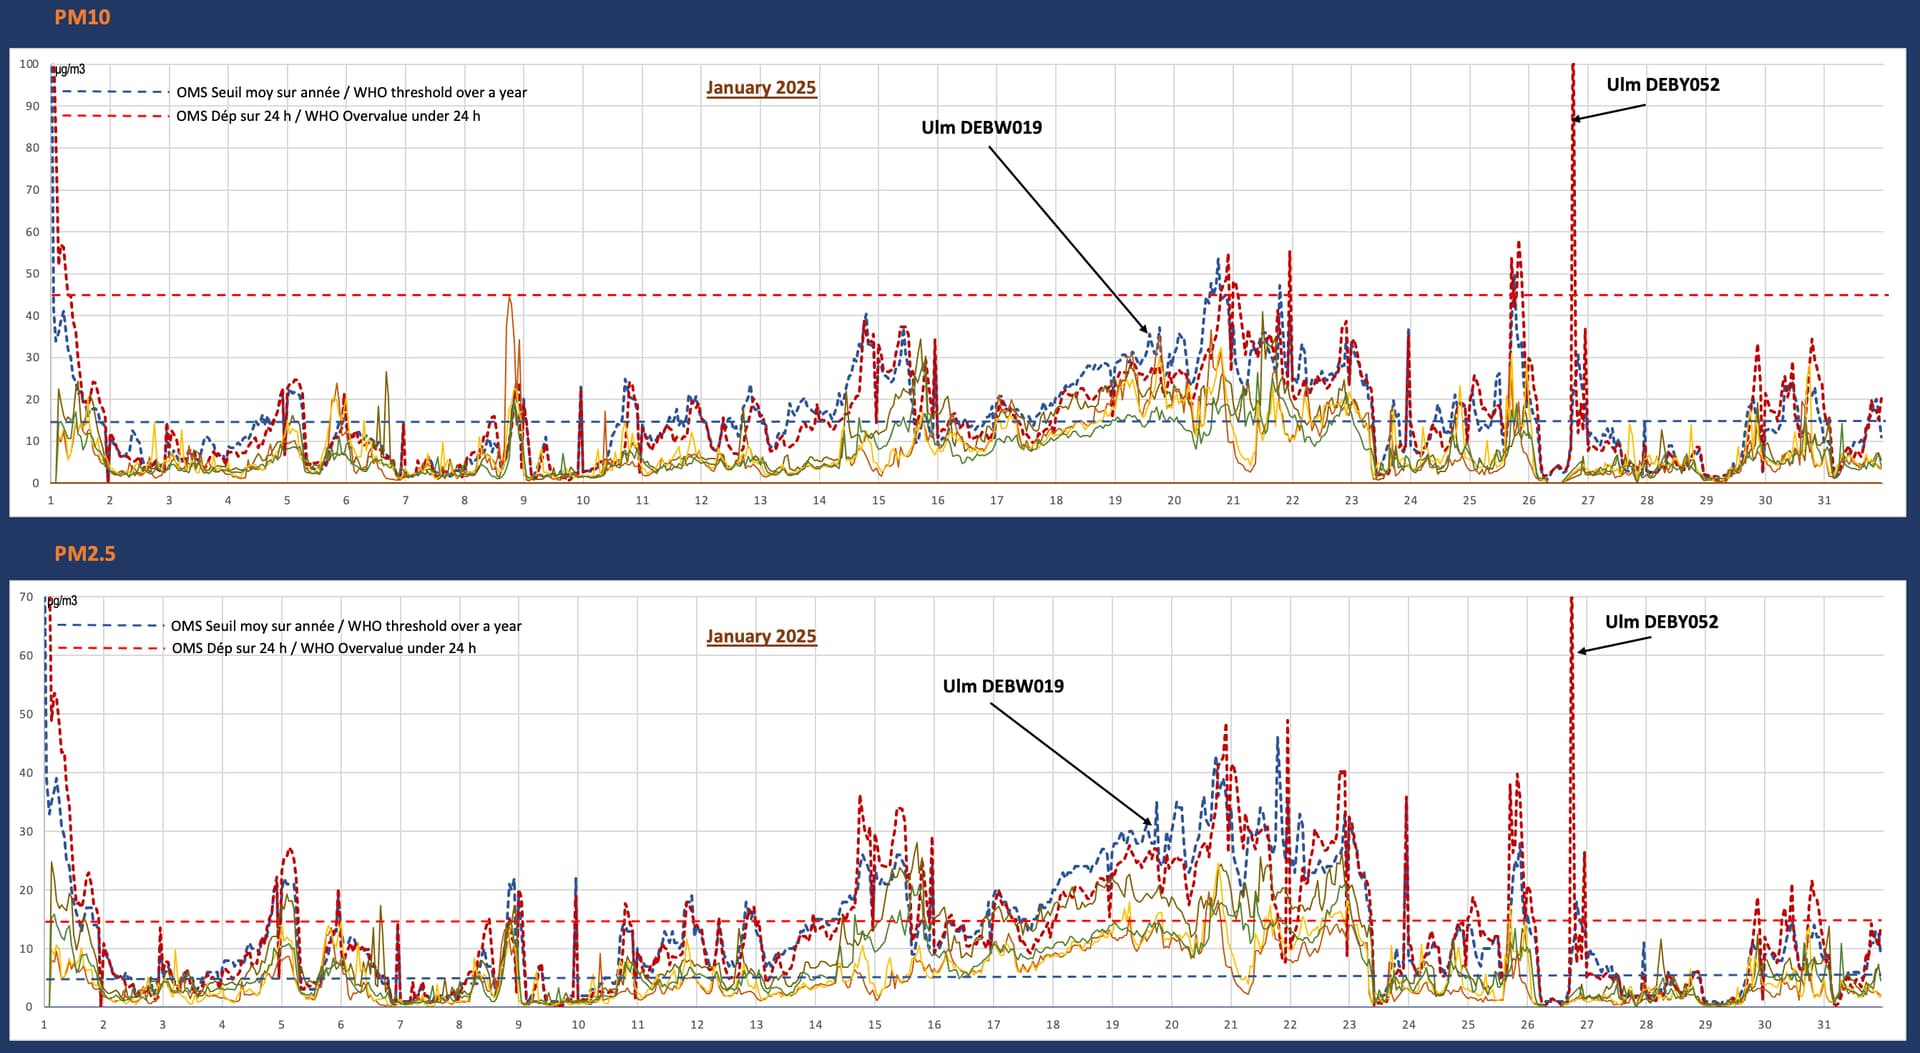
Third step: It is then necessary to apply a temperature correction to get more realistic values for community sensors. (this correction was defined by testing of a SDS sensor in a thermal closure).
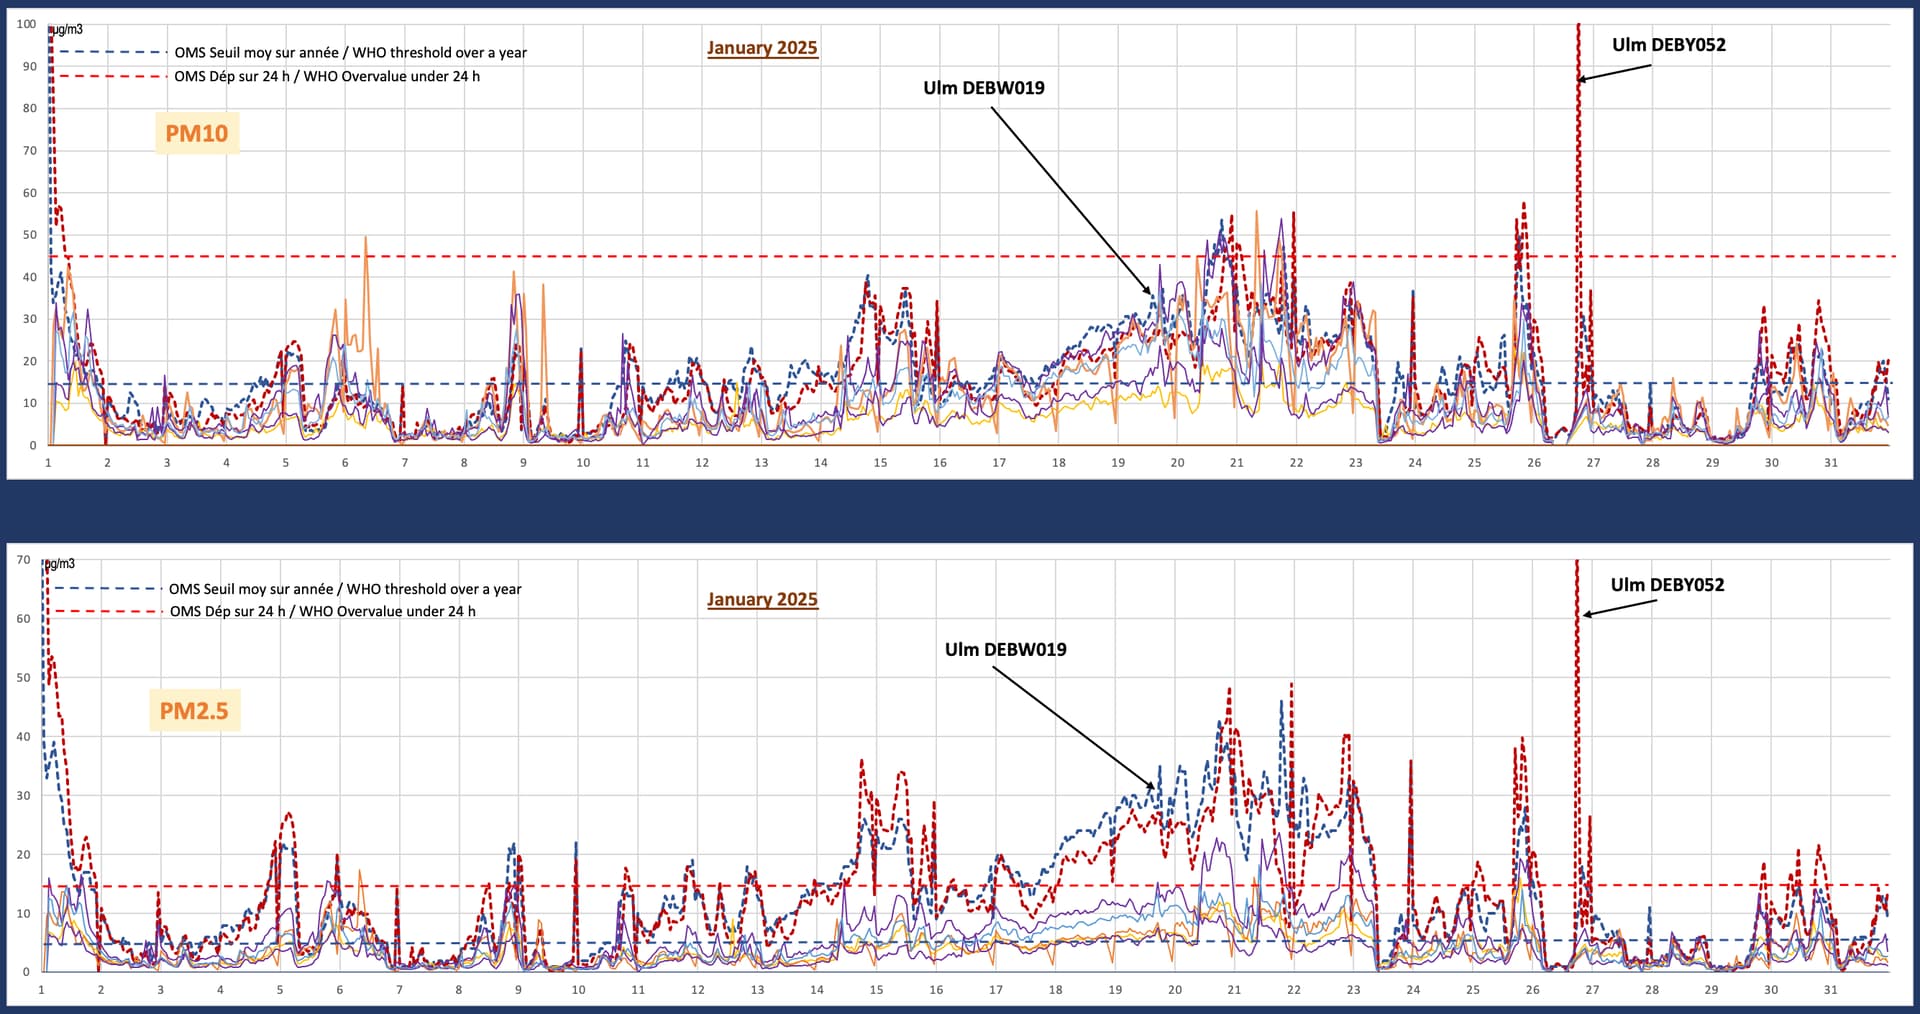
Once damped the SDS sensor values transcribed a better dynamical behavior of the environment evolution comparing with the official sensors. However some deltas still exist in particular for PM2.5. We can notice that the official sensor DEBY052 is still displaying high peaks compared to other sensors; this may be due to a dedicated position in a disturbed area where community sensors are not present or exposed in the same way.
For PM10, the sensors ID579 - ID1178- ID 17993 in Ulm perfectly transcribe the evolution of the official sensors; the sensors ID8252 and ID28070 do not translate the same trend: this could be explained by a particular position of orientation of these sensors. For PM2.5 the thermal correction seems to be too high and would need to be optimized.
Conclusion:
The SDS sensor is still an efficient sensor to assess the trend evolution of the air quality assuming we apply the necessary corrections which are required in complementary to the simplicity of its concept. It is non sense to compare values with official sensors point by point; the global behavior and measurement order is quite satisfactory to identify quality disturbances and to determine the global quality in a dedicated area where no official sensors are available.