Hi,
I have added yesterday two new sensors, but I cannot see them on map (calling the map URL only and zoom in). I see another (older) sensor near my location, but not my…
If I check the devices and click on the link here (show on map) I will see the location with both devices and the values.
Is there a period of time after which the sensor is displayed?
Please read the instructions attentively and compare the configurations in the sensors and in devices.sensor.community. They must be the same. It is very unlikely that the problem comes from something else than the human being… Please send pictures with the Board ID and the Sensor ID like @Ben21 did. We were able to solve the issue quite fast.
I think I found out the problem:
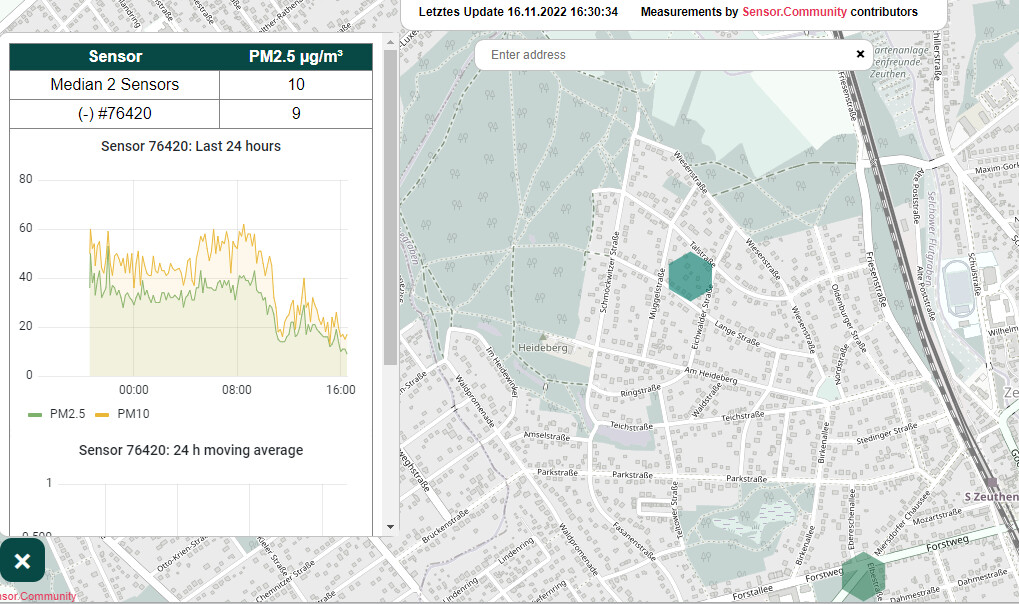
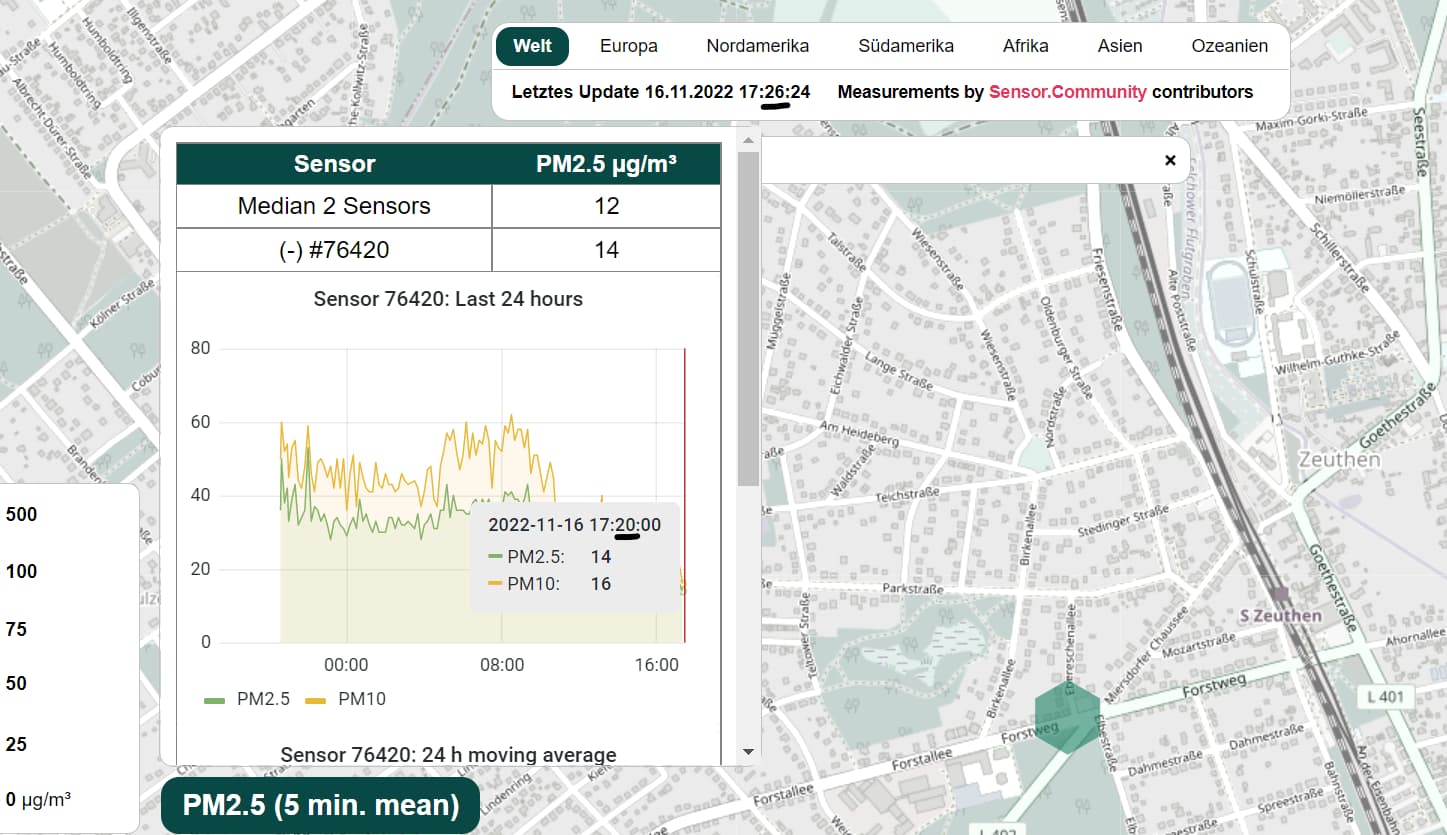
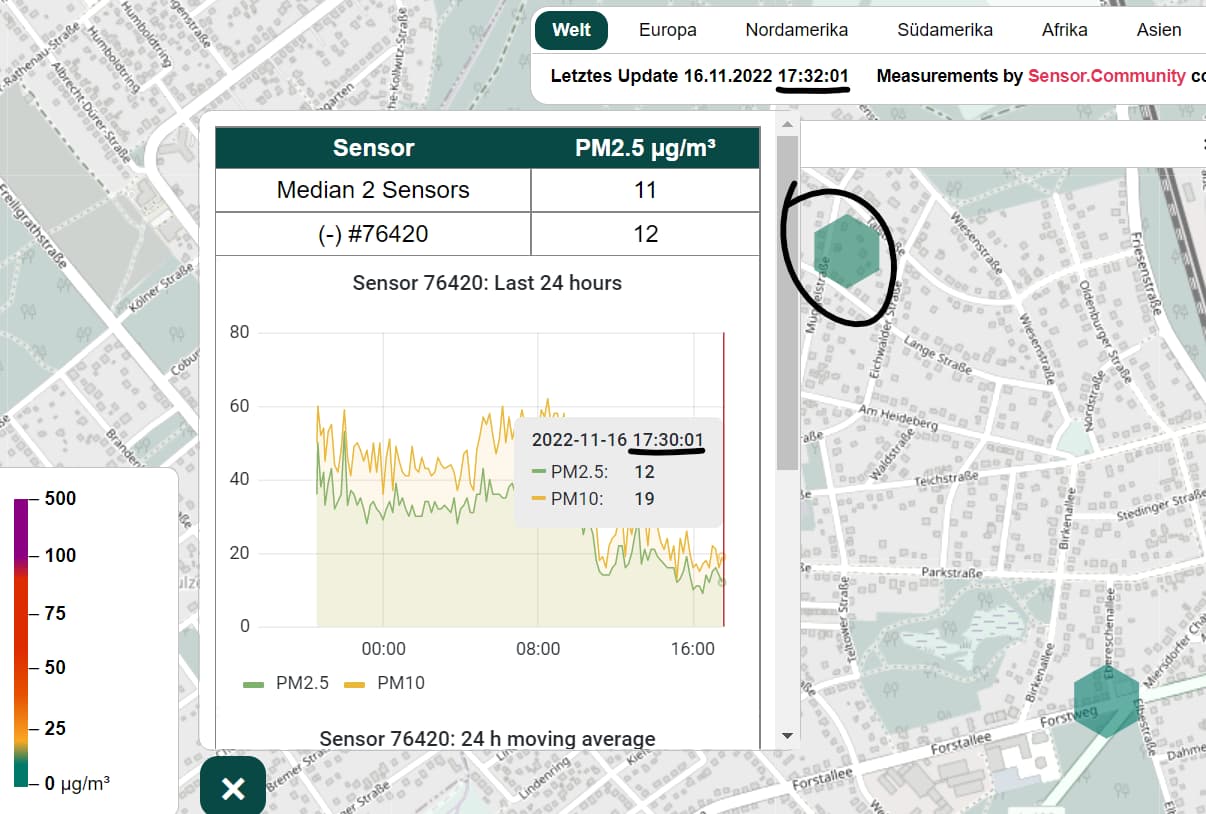
The sensor is not showing up on the first screenshot because his sensor didn’t measure anything at that exact moment. A minute later, the second picture, it measured again and showed up on the map.
→ @micha_pr , the map only shows sensors that are measuring live. When you look on your Grafana dashboards (actually also visible on the map itself) you’ll see that the sensors is not measuring continuously but only once in a while…
So the problem is not the configuration or the sensor.community website, but something else.
@micha_pr please check the WiFi signal of the sensor. That causes a lot of interruptions with the measurements…
Hi,
thanks for the help ! That seems logical… more or less.
I forgot to tell you (maybe the most important detail) that this sensor is a self made sensor and I’m reporting from Home Assistant using the API and the POST command to https://api.sensor.community/v1/push-sensor-data/
So I have only the config from the add sensor data page.
you’ll see that the sensors is not measuring continuously but only once in a while…
Sensor is reporting every 10 minutes - is this not enough?
I just now have added the POST to https://api-rrd.madavi.de/data.php
Not sure, is this mandatory ?
Maybe I have not found the right configuration tutorial for custom sensor integration, sorry.
Is there any? Would be glad to finish my configuration with all needs.
@micha_pr
To see the data on devices.sensor.community just click New tab (sensor.community). Make sure you have an account and added you sensor. If you need help adding the sensor, feel free to message me anytime…
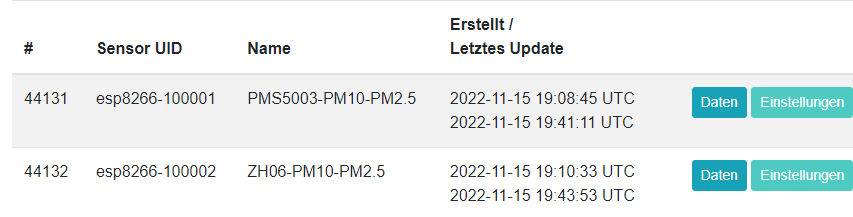
This page about new sensor I know. But my sensor already was ready since a longer time before, have used it in Domoticz and now in Home Assistant (via local MQTT broker). That’s why I was lookig for a configuration manual for already existing sensors. Maybe I can create such manual when I’m ready with all
I have several sensors, PMS5003, ZH06 and SPS30 - all of them reporting to my databases.
Using it already 2-3 years, SPS needed a cleaning in the meantime
PMS and ZH06 have purchased at Aliexpress without any problem.
Have connected to Wemos D1 with own sketch reporting to syslog and MQTT broker.
SPS30 from Germany (about 35€)…
Data of sensors I have seen - and I think I have solved the problem!
I have changed the reporting interval to 4 minutes and now all is fine.
The Grafana graph is ok, but I do not need it, have detailled chart at Home Assistant…
If all is working stable will add the final comment here.
Thank you for you help - and the final hint about the reason of hidden sensor (missing data) !!