so, where is the truth ?
we build our networks on SDS011, but i think it counts less than the two other sensors.
Test is running in the same place, my balcony, with the same other equipment, nodemcu, case, etc..
1 Like
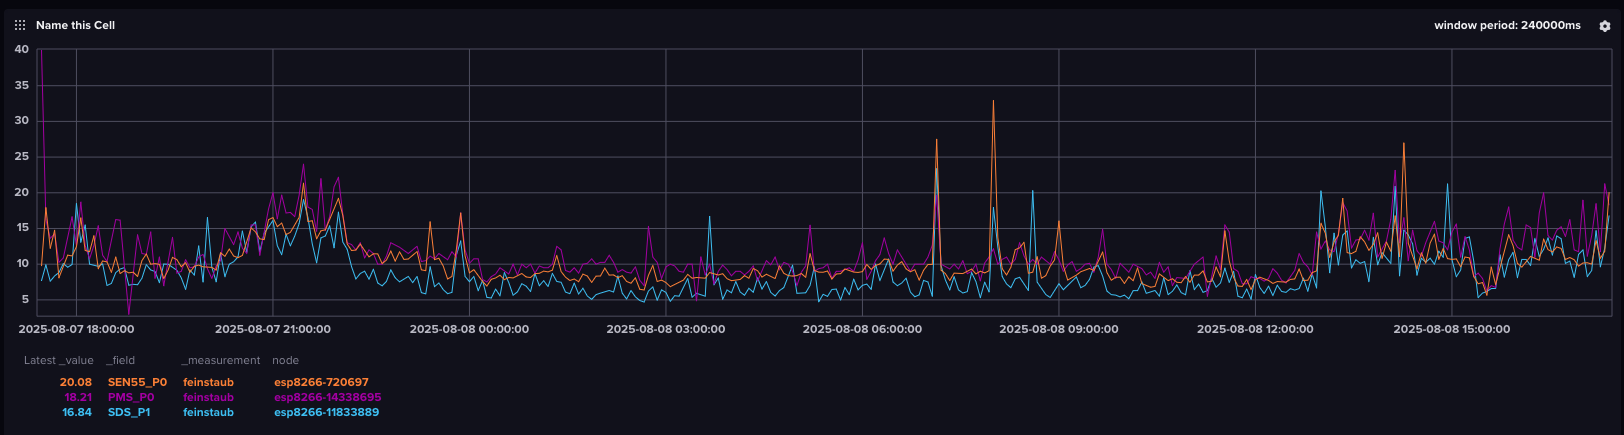
To be fair: yes, there is a difference.
It’s not extreme, though. There is one peak where the SDS011 doesn’t follow ‘up’, but in other peaks it does. Also, you tested this under pretty good air quality conditions, really. I’d be interested to see what would happen if the pm2.5 values of the other 2 sensors went well above, say, 35 (AQI 100) for a longer period of time (multiple readings).
Yea, like I said before, there’s a difference but it’s not wild. And, again, the AQ is really pretty good during the time of all these measurments. Maybe the values start drifting more when the pm2.5 values get a lot higher - for now, I’m not super worried about the difference.
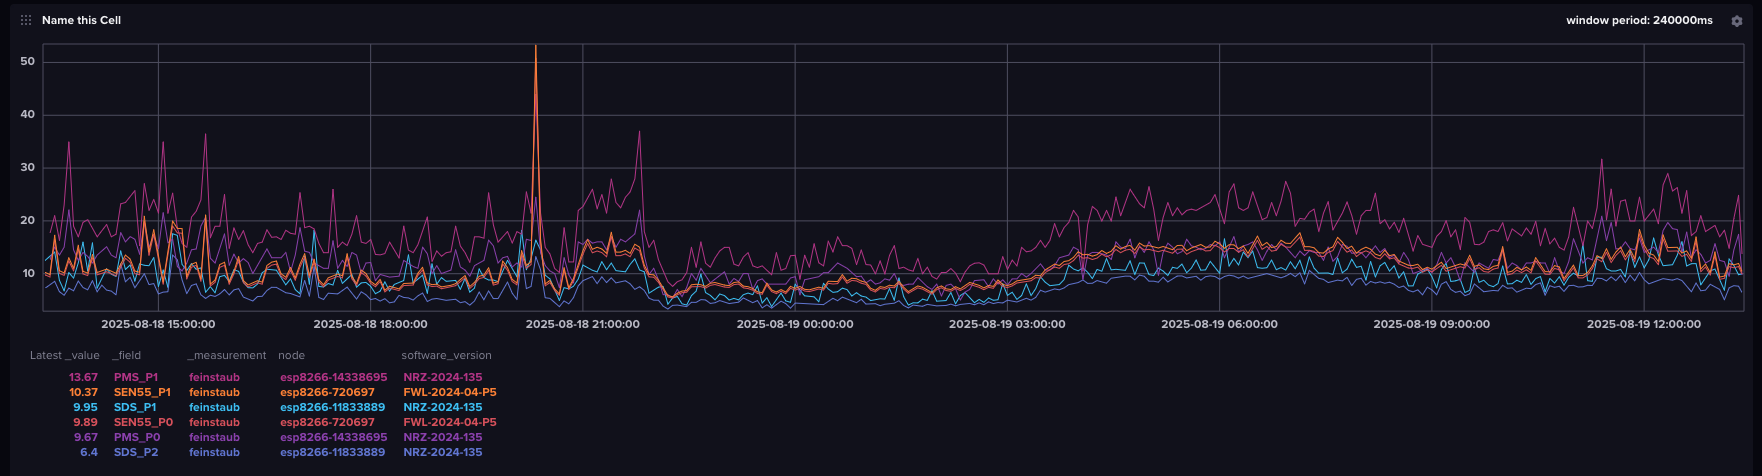
Also it looks like you are comparing PM1 values for the SEN55 and PMS5003 (*_P0) with PM10 values for the SDS011 (*_P1). It would be better to compare the PM2.5 (*_P2) values across the sensors. There still will be differences but it will be a more valid comparison.
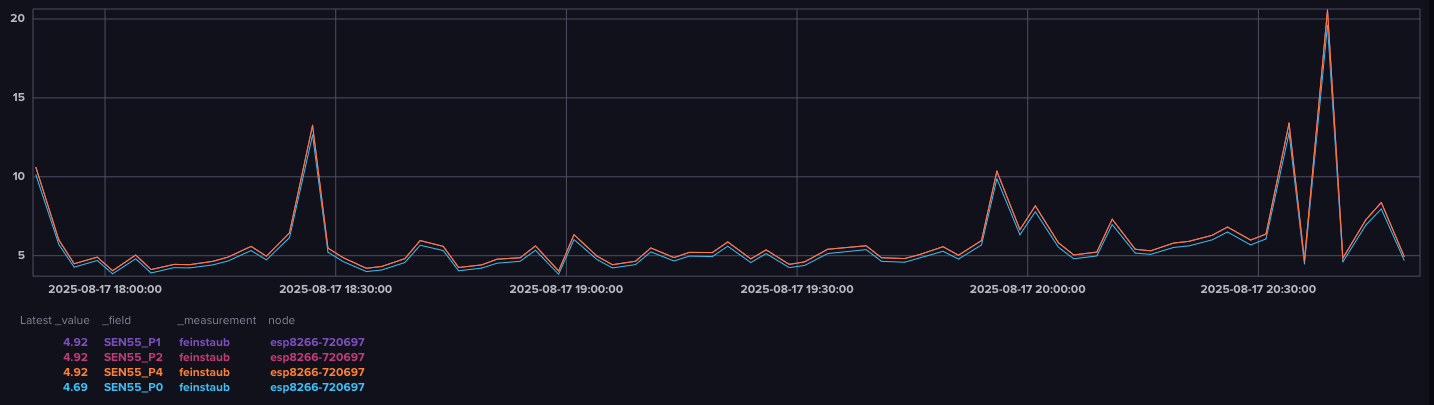
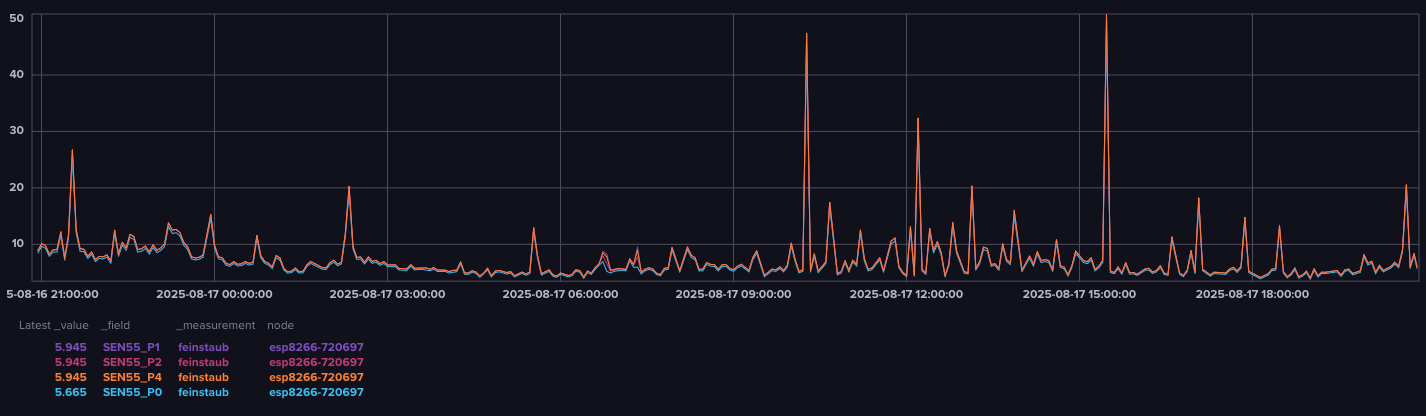
sen55 is a sad story…
supposedly it has pm1, pm2.5, pm4, pm10.
only pm1 seems to be reliable.
we abandoned the builds using sen55
Fair enough. However you still shouldn’t compare the PM1 values with the PM10 values of the SDS011 as if they would measure the same. I would still be curious about the comparison of the *_P2 values of the three sensors.
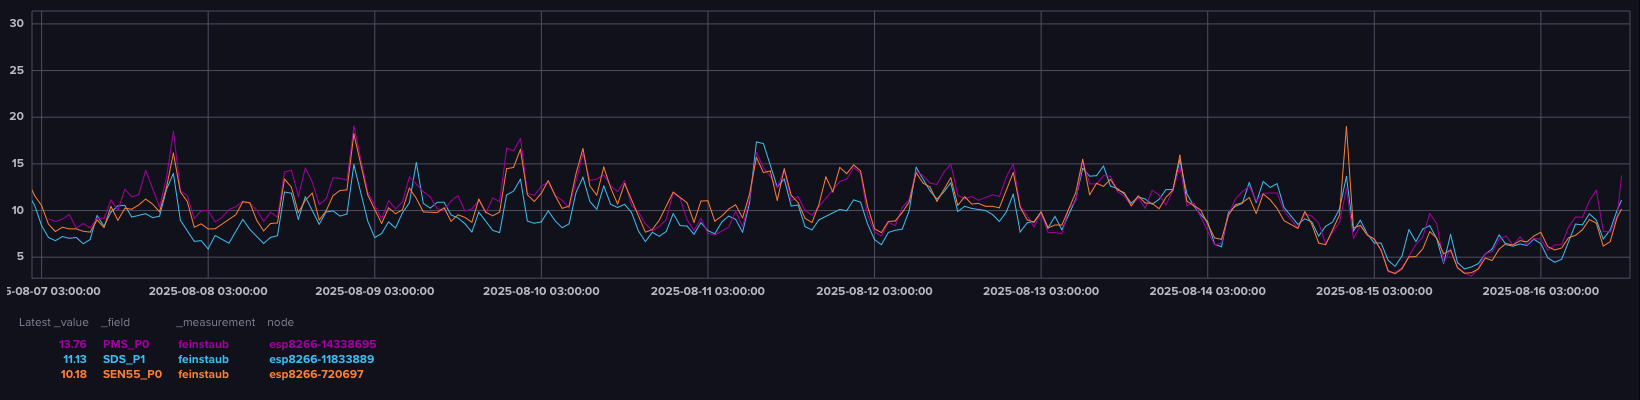
Ah yes. This was mentioned in Implementation of new Sensirion SEN-5X sensors - #99 by fredvduin . Based on that I would suggest to ignore the Sensirion PM4 (*_P4) and PM10 (*_P1) measurements. Then if you compare the SEN55_P2 with the PMS_P2 and SDS_P2 values perhaps for just PM 2.5 it’s not that bad after all ![]()
I don’t see the SEN55_P2 and PMS_P2 values in that graph, only their _P0 values. Could you make a graph with only the _P2 values, no _P0 and no _P1?
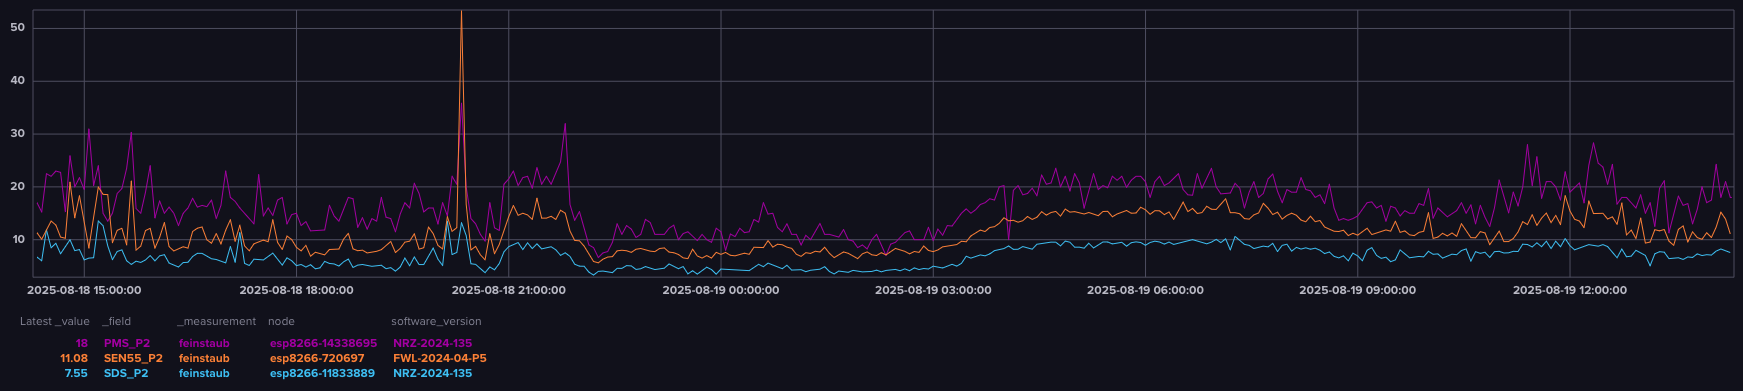
Nice! This actually looks pretty good given the known inaccuracies of the sensors. The SDS011 tends to underestimate PM2.5 with lower (<20ug) concentrations. The PMS (7003, so perhaps also the 5003) tends to overestimate. I don’t know about the Sensirion but the graph more or less confirms these known inaccuracies The three sensors also correlate with each other (except for the peak around 20:00). So it looks like for PM2.5 they all tell their own version of the truth within a known and mostly acceptable bandwidth.
Please remember that we’re dealing with cheap hardware and you can’t expect the absolute truth from neither one of them.
I second this.
I use the SDS sensor integrated into HomeAssistant to shut down the ventillation system in the house if the air has particle levelt above a reading, smoke outside for example.
in the next days i will add a purple air sensor, trying to get the data into my database..
i will keep you informed..