The sensor I had built was created using the tutorial supplied by a blog on pimoroni for some reason I had to change the A to a 4 as it does not allow luftd4ten , I would like to know how I can get the data I’m sending to be shown here: Grafana
The air quality monitor was built using the Raspberry Pi Zero W and I’ve registered the sensors correctly, however when I search for raspi-xxxxxxxxxxxxxx nothing appears on the dashboard.
Good evening,
As we always tell (have you searched on the forum?), Pimoroni hardware are not supported by Sensor.Community. You should ask on the Pimoroni’s forum but of course they won’t answer like me because it is a commercial company and no civic-tech project supported by normal people…
People who can’t program perfectly and read C++/python firmware should only use our instructions…
Anyway, I will need to see your raspi-ID.
The Pimoroni’s firmware developed by Rohit Chakraborty (you can read his science paper about AQ) already 5 years ago is supposed to be used with an Enviro+ Hat. is it what you have ?
If you have another sensor and a proficiency in python or C++, you can refer to the official API page:
Or you can send me a Raspi and the Hat I promised myself I will never blind code again.
Actually I still have to debug a Enviro Urban for someone from the Forum. @him: I have not forgotten you, the board sits well on my desk and I have found a solution a least for the PM.
Please send me:
the ID
the code
the full set up as pictures
I will also probably need an access to your account on devices.sensor.community
I am sending data to sensor.community since Sunday and would love to see it visualised in Graphana. From what you wrote one needs to send you the parameters (ID for example). Does this still stand? How can I do this? As a private message here or is there an appropriate email?
As to Pimoroni, they are quite helpful, they just answer slow. I am sure if they knew about the pain, they would change the L****n name in their article title to sensor.community.
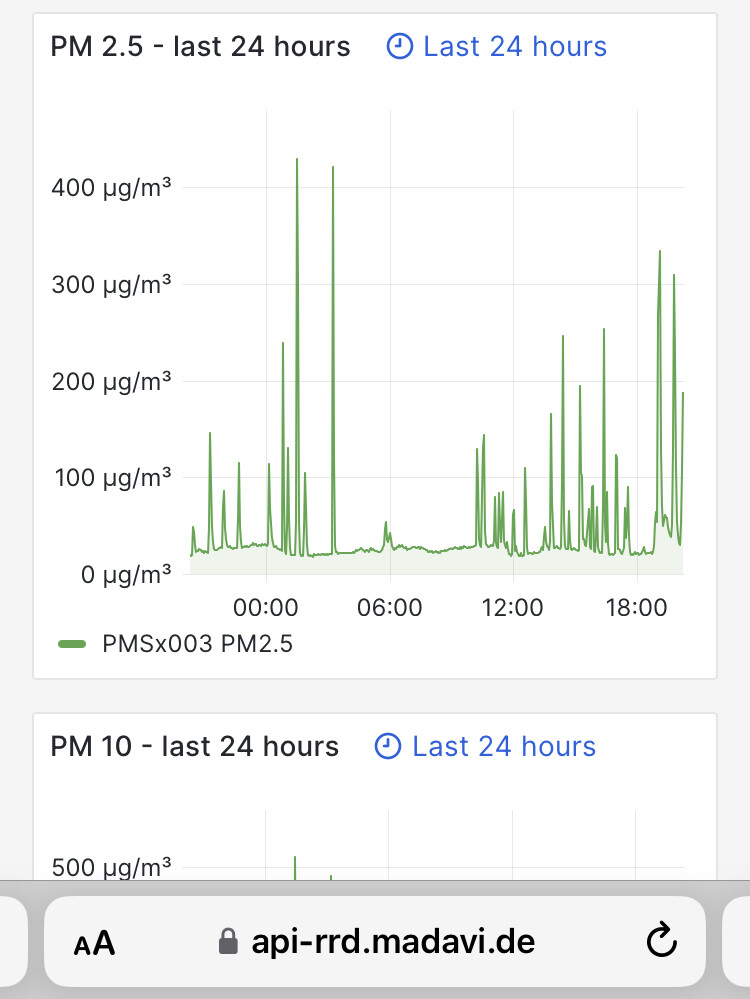
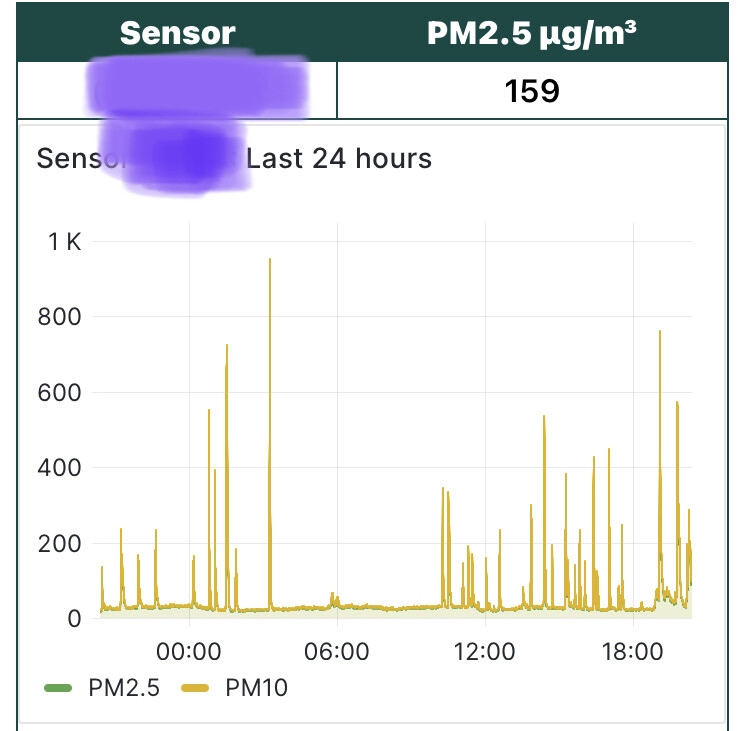
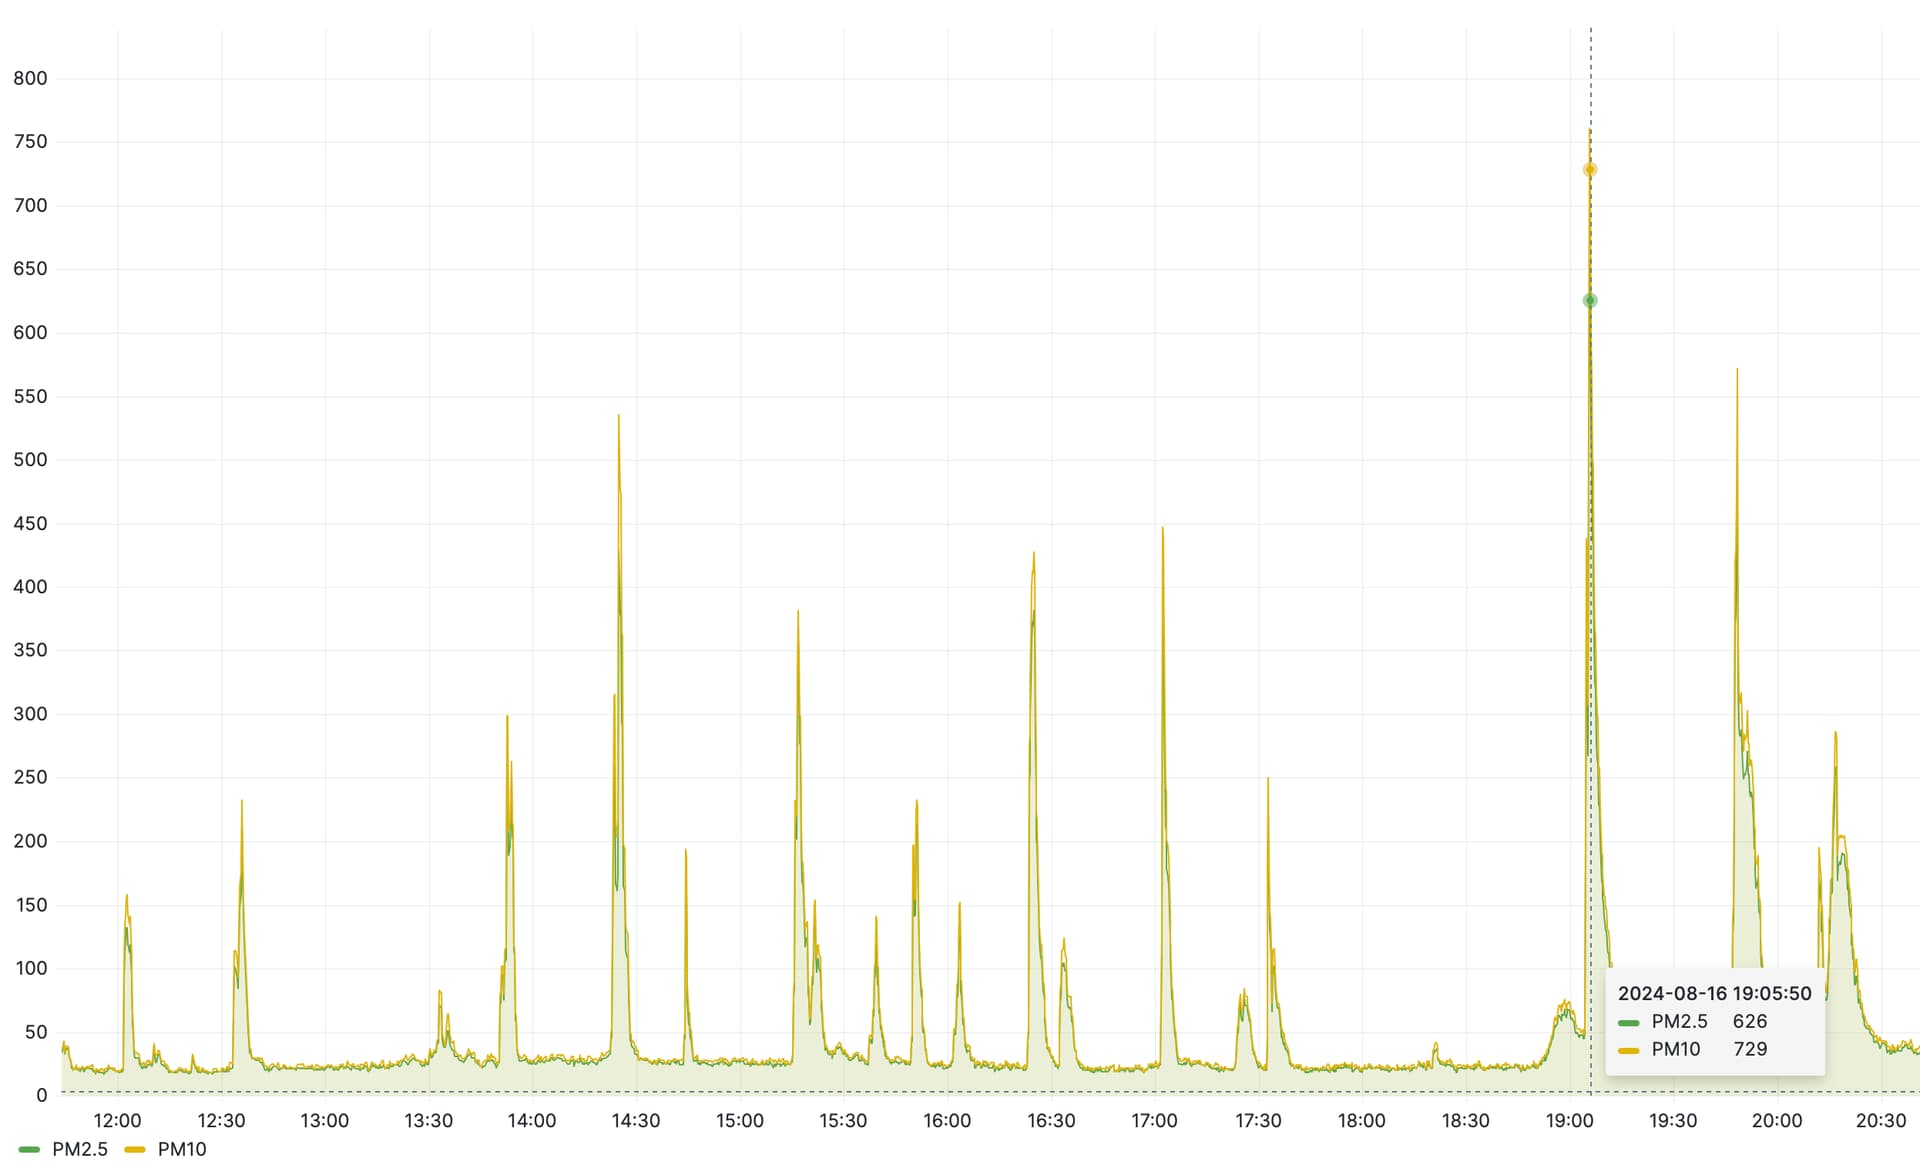
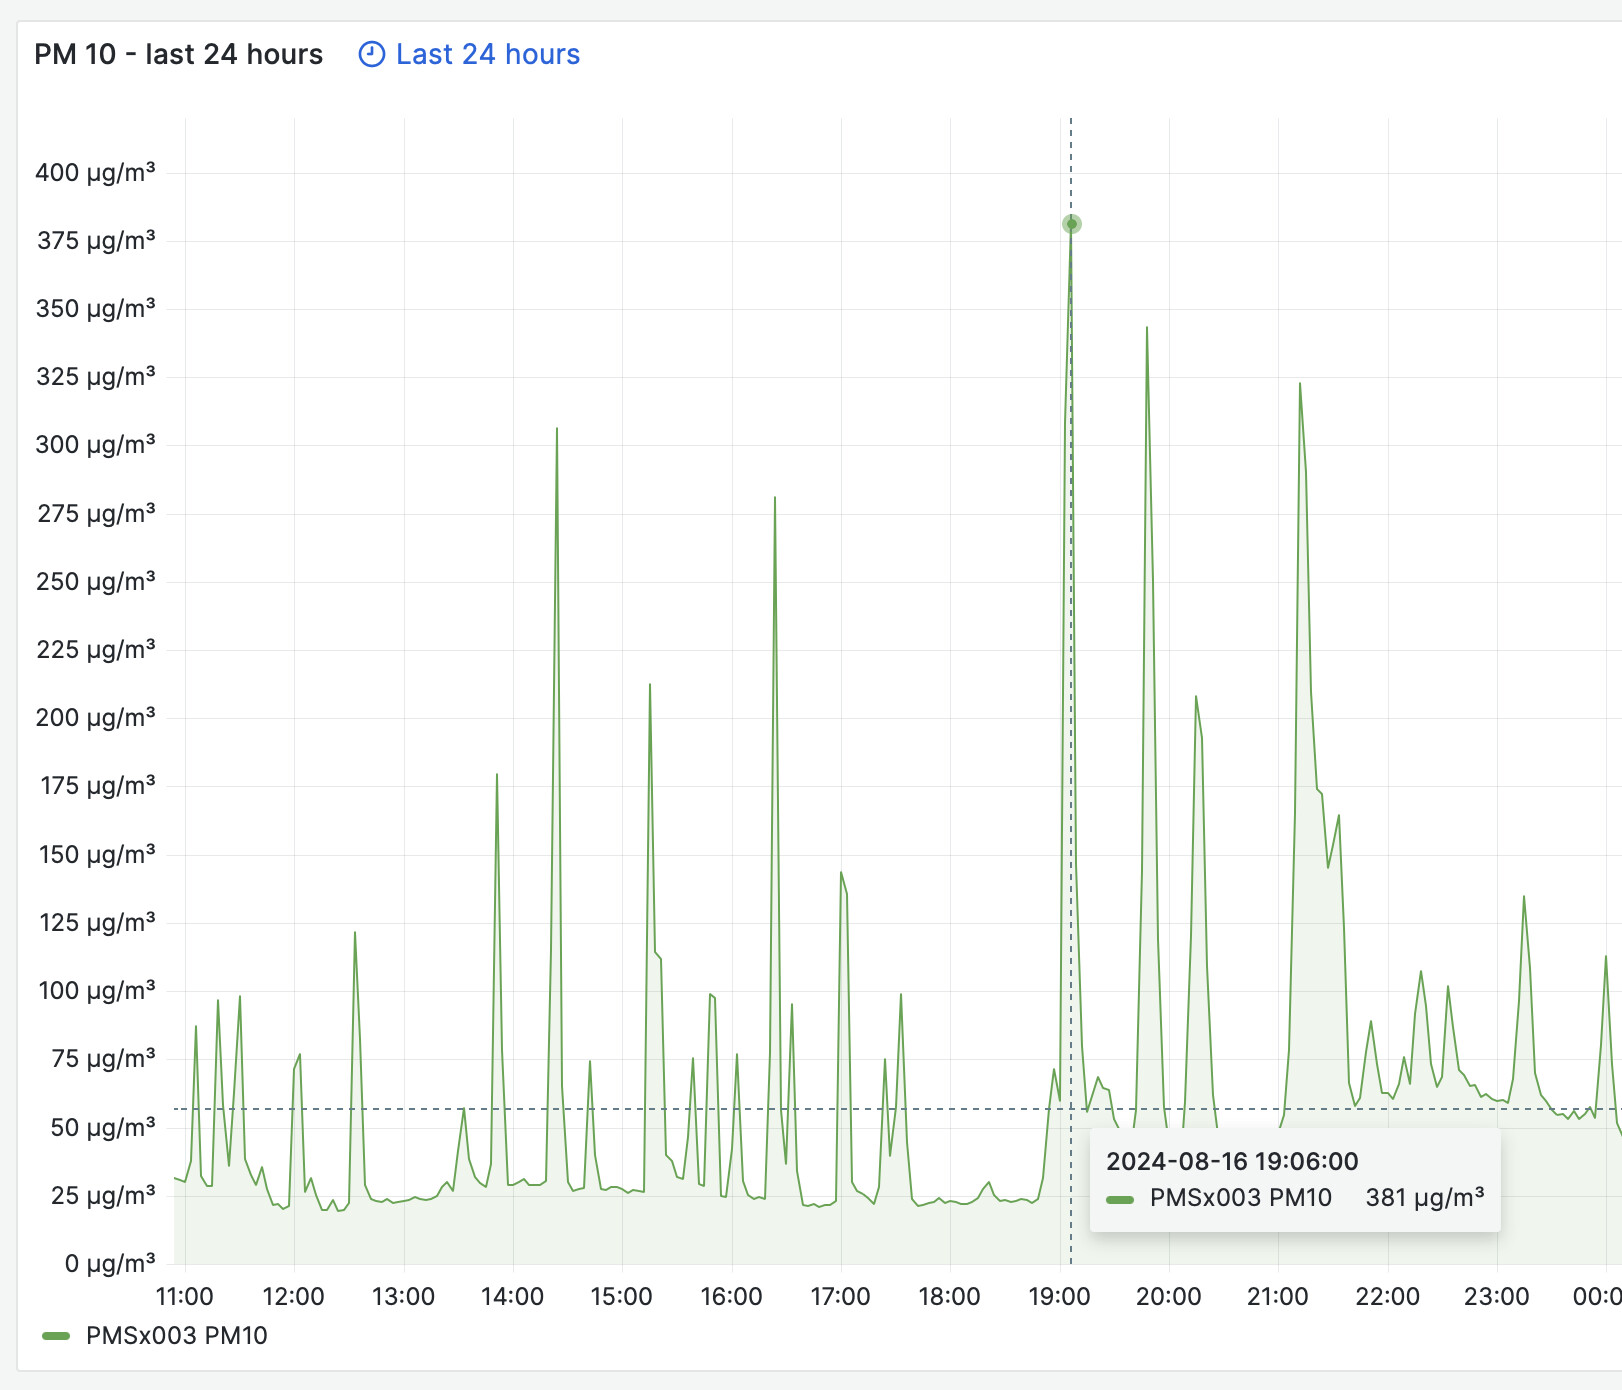
I have one question about the values - on chart opened from the map the values are a lot higher (950) than the ones opened from madavi (420). It’s almost like they are doubled. Why is it so?
@sikorka I will check this. Grafana is a bit tricky …
Could you please send me a PM with the two URLs of those graphs. In the URLs I can see which panels are used to display the data.