Reducing CO2 footprint of the sensor network

Hi there,

I’m quite brand new here just bringing my first sensor online, and already going to start a “big” discussion. Please apologize.

My sensor is in the 34.000 numbers, so I assume it started with “1” and we have in fact several 10.000 nodes running.

The power consumption of my node (SDS011, OLED) measured over 24 hours was about 0.34 W. As my power supply may have a concersion efficiency of 70-80%, let’s say my installation consumes ~0.5 W in total.

It’s connected to a modern WiFi router. This router powers down when no WiFi device is online any more. Normally that’s the longest part of the day in my house, but as the dust sensor is 24/7 online now, this can’t be done any more. So, let’s add another 1W, and we have a power consumption of ~ 1.5W per station.

Multiplied with 34.000 sensors, this is 51 kW or 447 MWh/a. As CO2 emission per kWh in Europe is roughly about 400g, the already existing network has a CO2 footprint of 178 tons of CO2 each year.

Another discussion is how reliable the produced data is. It seems that when humidity rises above 70-80% rH, data is too way off to be useful at all. Mathematical correction algorithms unfortunately have to fail due to fine dust specific physics. It seems the only solution can be a pre-heating of the air.

Let´s assume we need a 10W heater for sufficient heating, and this heater has to have 50% duty time. So this will add 5W DC continuous power. With a power supply efficiency of 80% this increases to 6W. Adding the 1.5W for the sensor itself, if all 34.000 nodes should give reliable data, power consumption would increase to 255 kW or 2.2 GWh/a. Resulting in a CO2 footprint of 892 tons per year.

Even with pre-heating, sensor data would not be 100% reliable. Aging of the laser diode stays uncompensated, also dirt accumulation on the photodiode. There is some influence of wind, suction tube length, fan aging, and PM10 particles can not be measured by these cheap devices, they are estimated from the PM2.5 values by the sensor firmware.

Going further in the direction to increase the data quality of the whole sensor network would mean to become more part of the problem than part of the solution, due to the high CO2 footprint. And still the data would maybe miss some accuracy.

So what I would like to put into discussion here is a different attempt:

The community (whoever this will be in detail) can decide to put a few single stations on fine dust hotspots, which have improved data quality by preheating, an enhanced suction system, regular sensor changes etc.
For the big mass of the other sensors we accept that they give false data when they have to run outside their specification.

But data that is false has no value and has not to be collected.

So, when the humidity sensor of a station reads over 80% rH, it can shut down WiFi and PM measurement. It goes into sleep mode, waking up every 5-10 minutes to get a humidity reading to decide if it will sleep further, or if it can restart to measure.

Thus, power consumption of the sensor itself is decreased to basically the idle running load of the power supply, which is normally not more than 0.1 W due to legal restrictions. The WiFi routers can power down their WiFi to save power. And in the map, these sensors can be marked in e.g. grey or black colour, indicating that they are running out of specification at the moment.
For a visitor of the site, it is clearly visible that at the moment no useful data can be taken. This is transparent and fair.

Just an idea.

Andreas

Could you please check your maths?
There are around 15.000 devices online at the moment. The counting didn’t start at 1 and isn’t really consecutive as users may register devices with wrong chipIDs and deleted those afterwards. Other users may have decided to shutdown their devices and deactivated them.
Most devices contains 2 or max. 3 sensors (i.e. SDS011 + BME280 instead of an OLED display which only very few users are using). And in most households the wifi will run 24 hours as i.e. smartphones and other devices are connected and online most of the time. In many countries telcos have switched to VoIP and are selling DECT and Wifi phones so that the routers will need to be online for these devices all the time (or would you like to start your router first in case of an emergency?). So adding the power consumption of the router only because your would shutdown the wifi most of the time isn’t really a good assumption.
A year has 8760 hours. Multiplied with 1.5 W (your assumption, including the additional consumption of the router) we have 13140 Wh or 13,14 kWh.
So we have 15.000 devices with a power consumption of 13,14 kWh, summing up to 197100 kWh/a (or 197,1 MWh/a). This multiplied with the 400g / kWh CO2 will give 78800 kg or 78 tons. Without the additional power consumption of the router this would be 26 tons CO2.

Wow… your assumption is simply wrong. Please do your research before posting such things. 10W? Are you trying to burn your house down?

PTC heater used in Nettigo Air Monitor has resistance between 7.5Ω to 22Ω depending on temperature.
So basically it’s equivalent to 1W-3,3W (we use 5V). When it is on it consumes around 1W-1.5W. Maximum power is used only when heater is cold. Duty cycle depends on relative humidity. Heater is controlled by SHT30 via mosfet.

Hi Rick,

my maths are not that bad.

The information that “only” 15.000 sensors are online is not available to the public - I searched quite a bit unsuccessful to get this number, but finally had to rely on my sensor number. This is the only value you changed in your maths.

Concerning the WiFi, I have a Fritz!Box (very common model here in Germany where most of the nodes are based) that uses the WiFi power saving function I described. There would be no need to implement it if it would be useless. If your smartphone receives a message during the night, the message arrives first at the router, which then activates WiFi and sends it to the phone. It is pushed, while your phone is in “sleep” state. For the dust sensors, information goes in the opposite direction, so “push” can not work.

The OLED I use, which is supported by the firmware, runs at 3V and consumes less than 50 mW. Of course, a character LCD would consume much more.

Still the question remains why energy is spent for collecting data that represents no real values.

Cheers,

Andreas

Hi Irukard,

of course I did my research.
Air from 90-100% rH has to be brought to ~35% rH to give reliable readings on all varieties of fine dust. There are diagrams for saturation of water vapour in air in relation to the temperature. To bring air of 100% rH and 10°C (autumn) to 40% rH, you have to heat it up to 27°C. This has to happen in a tube that is not too narrow, thus increasing flow resistance, and it has to happen in an unobstructed tube to keep laminar flow, so heating has to be done from outside. The tube has to have a certain diameter and shall not to be too long, as increased flow resistance has a huge impact on the sample volume, resulting in massive false readings - we have only an unregulated fan in our sensors. You will not be able to heat up your sample air volume on maximum 20-50cm tube from 10°C to 27°C with 1-3W, even if the tube is very well insulated to outside air. And you also have to heat up the sensor itself to avoid temperature drop in the measurement chamber.

Cheers,

Andreas

The information about the count of active sensors can be found at https://sensor.community/, directly at the starting page. So I don’t know how we can make this information more public.
Really nobody can expect the accuracy of a calibrated device worth more than 100.000 dollars from our device. Our approach is more to get a picture of the air quality over an area. For this you don’t need the absolute values. And humidity doesn’t really differ that much in an area like a town. So all sensors in that area will show the mostly the same deviations. With that in mind the values aren’t that useless.
But this is the ‘german scientific approach’. Everything not exact by minimum 10 decimals is worthless… Sorry, irony. We have this discussion with so many institutes. For others it was possible to find particulate matter ‘hotspots’ in towns (even those caused by events, where you wouldn’t have the same humidity every time). In another work people could clearly detect the main approach lane of the airport Berlin-Tegel. You just have to go away from absolute values.

1 Like

Wifi: Do a passive wifi scan while your Fritz!Box is in ‘power save’ mode. You will see wifi packets even in this state. Otherwise clients wouldn’t be able to see it while scanning for networks.
What the Fritz!box is doing is adapting the needed signal strength to the distance of the client. So as closer the client as less power is used to send packets.
Without power saving the Fritz!Box would send with max. signal all the time.
The sensor is only sending every 2.5 minutes (if not changed in config). So even if the Fritz!box would communicate with full signal with the sensor it would do this only a very limited time. Most time the sensor will listen only.

1 Like

50-60% RH is good enough for SDS011. In this RH range readings looks very similar to certified national stations. IMO there is no need to go as low as 35% RH. In NAM I placed SDS011 in enclosure with vents on the bottom. This way warm air from SDS011 fills entire enclosure first effectively heating up sensor.

So let’s take a look at data from December 2020 from one sensor with Heater Duty Cycle set to 100%. This sensor is testing the limits of our heating chamber.

So basically this sensor reached 30-40% RH with small PTC heater consuming on average between 1.25 to 1.5W depending on weather. Target RH% for HECA can be set in firmware. Right now it is 60%, but there is no problem with setting it to lower value.

I can see you like numbers. So here is specs of our heating chamber.

Chamber volume
[mm³]
Heater volume
[mm³]
Air volume
[mm³]
Heater effective area
[mm³]
22808 3665 19143 1674

This chamber introduces dead volume (19.1 cm³), making changes in outside air pollution appear later than they are occur. Heating element is inside chamber. Air has some time to heat up between work cycles. This method is far from perfect, but it gives good values with relatively low power consumption.

1 Like

Hi,

about finding the total number of active devices: my entry point was luftdaten.info. The link from there goes to deutschland.maps.sensor.community, so usually you never see sensor.community page. On google are only old numbers (e.g. 3oo devices in 2017) to find. Btw, I can still not see the numbers there. Maybe some advertisement blocker I have running suppresses the output (“An error occurred”).

Why I opened this discussion: a lot of professional research has been done in the past years concerning low-cost dust monitoring systems. But I have the impression that unlike the extremely pleasing webinterface and quite a bit of effort taken to facilitate firmware installation, on sensor design and data quality this research seems to have had nearly no impact to the project at all. On the other side the network is growing, so the environmental footprint is rising. This project is a strong message to the politics, and maybe started political discurse about this topic much more than any collection of signatures or demonstrations would have done. This is absolutely great. But in the end, it’s only a “picture for the media” and that’s mostly it. The data behind it is not all the time realiable.

I agree that nobody would expect 100% precise results from a citizen network like this. But precise numbers are provided at the map, and most people will take only a short look, without digging deeply into the details, as a scientist would do. The website provides no help to the broad public to distinguish obviously false readings from those that are more reliable. You can click on each sensor to see the PM data short-term and long-term, but there is no direct overlay of humidity data. Also, it would be possible to introduce error bars, so data quality could be seen by a glimpse. The map also provides an AQI layer now, so it makes a statement about the healh risk in an area, but based on partially wrong data. It is something different to collect data for scientists that are able to identify Tegel airport approach lane even in foggy weather with this data, or to provide a health statement to the broad public.

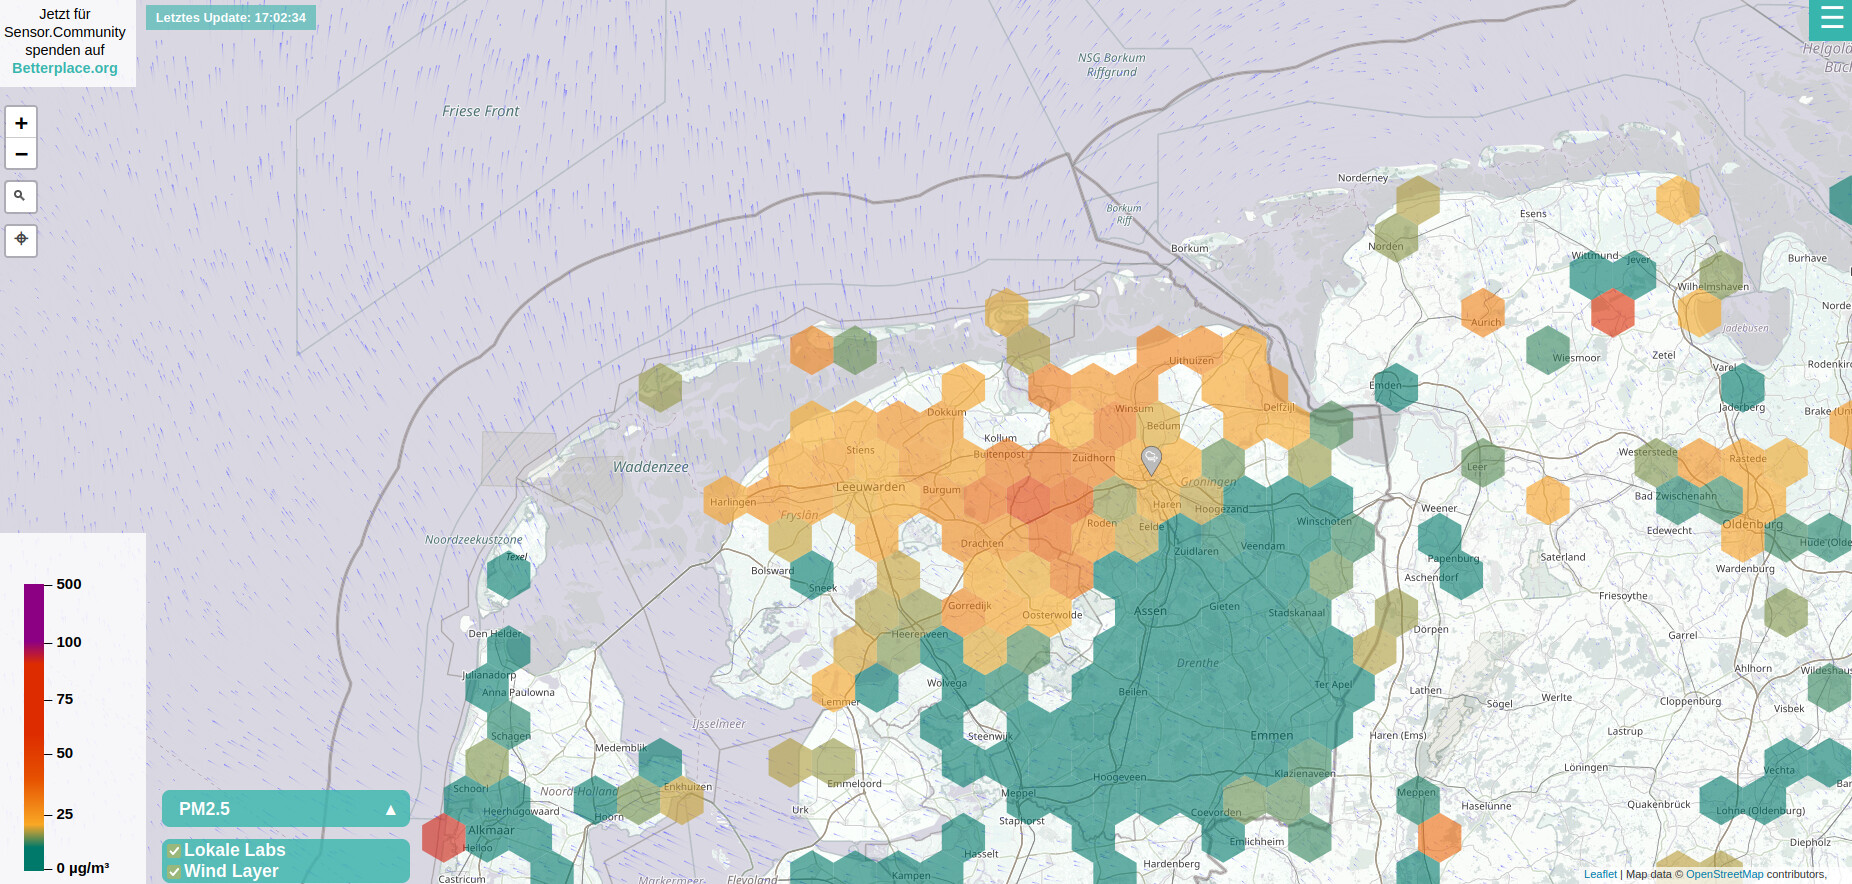
I took some screenshots yesterday from the Netherlands’ coast.

What you can see is that there is a whole region with high PM2.5 values. A lot of stations are yellow. But it is in a coastal area with a lot of wind, where barely no one is living. So where comes the fine dust from?

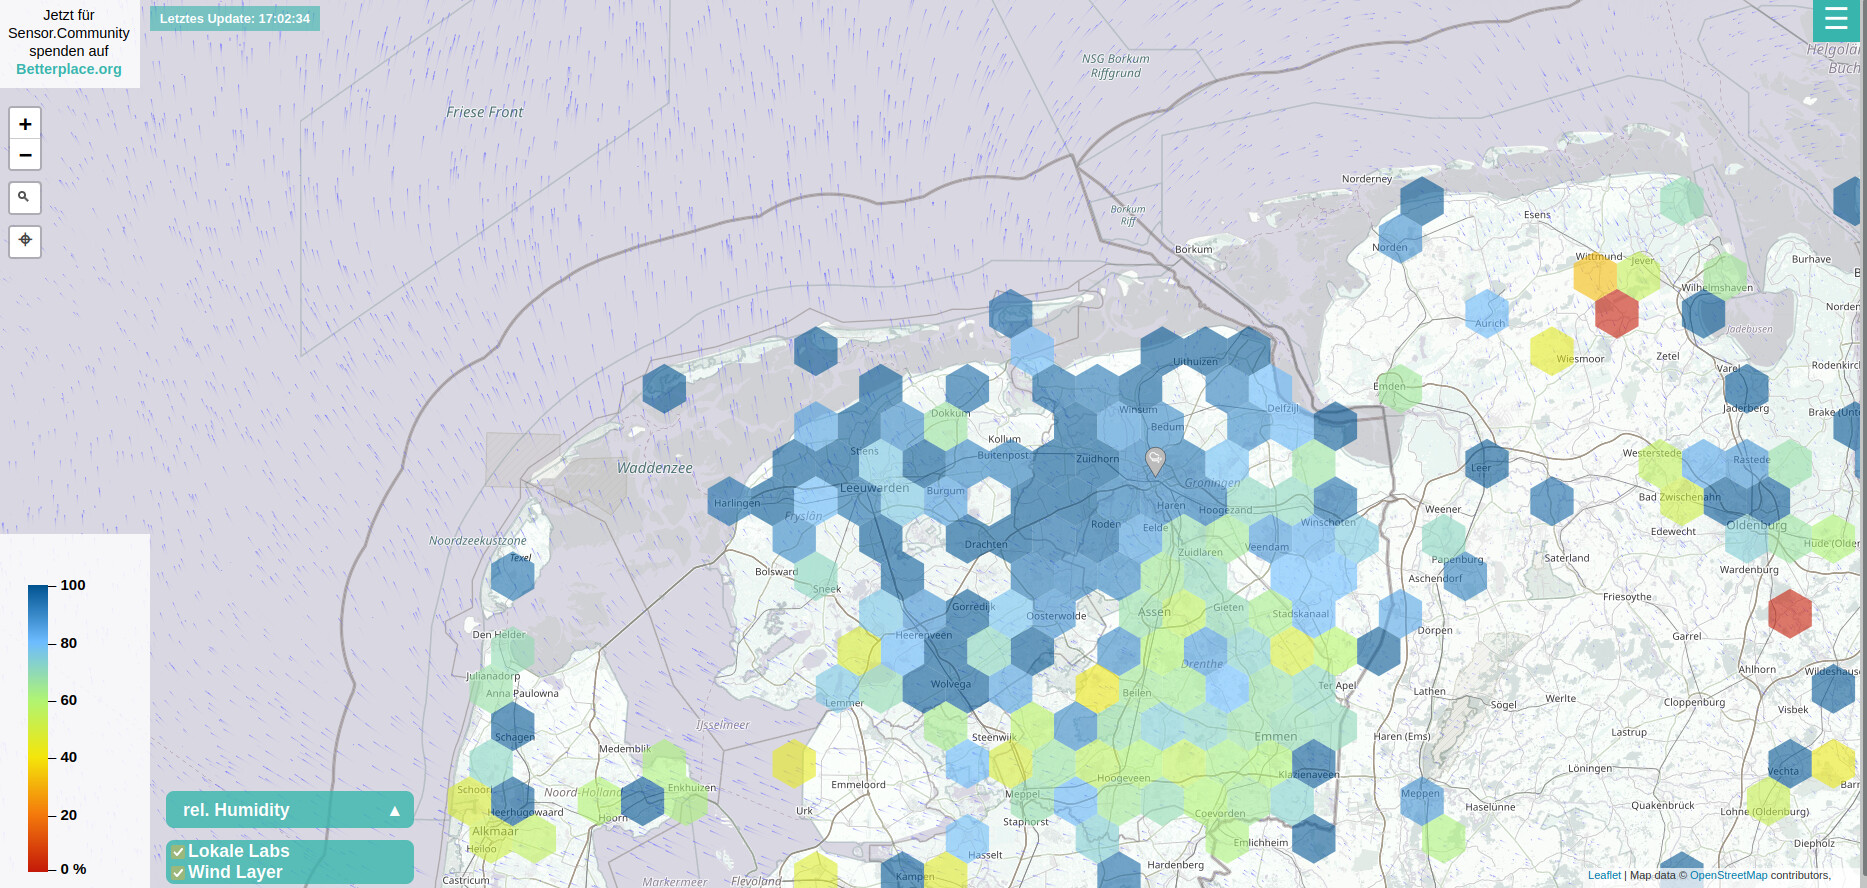
Switching to the humidity map, you can see that exactly in this area humidity is above 80%. Maybe it’s simply raining there.

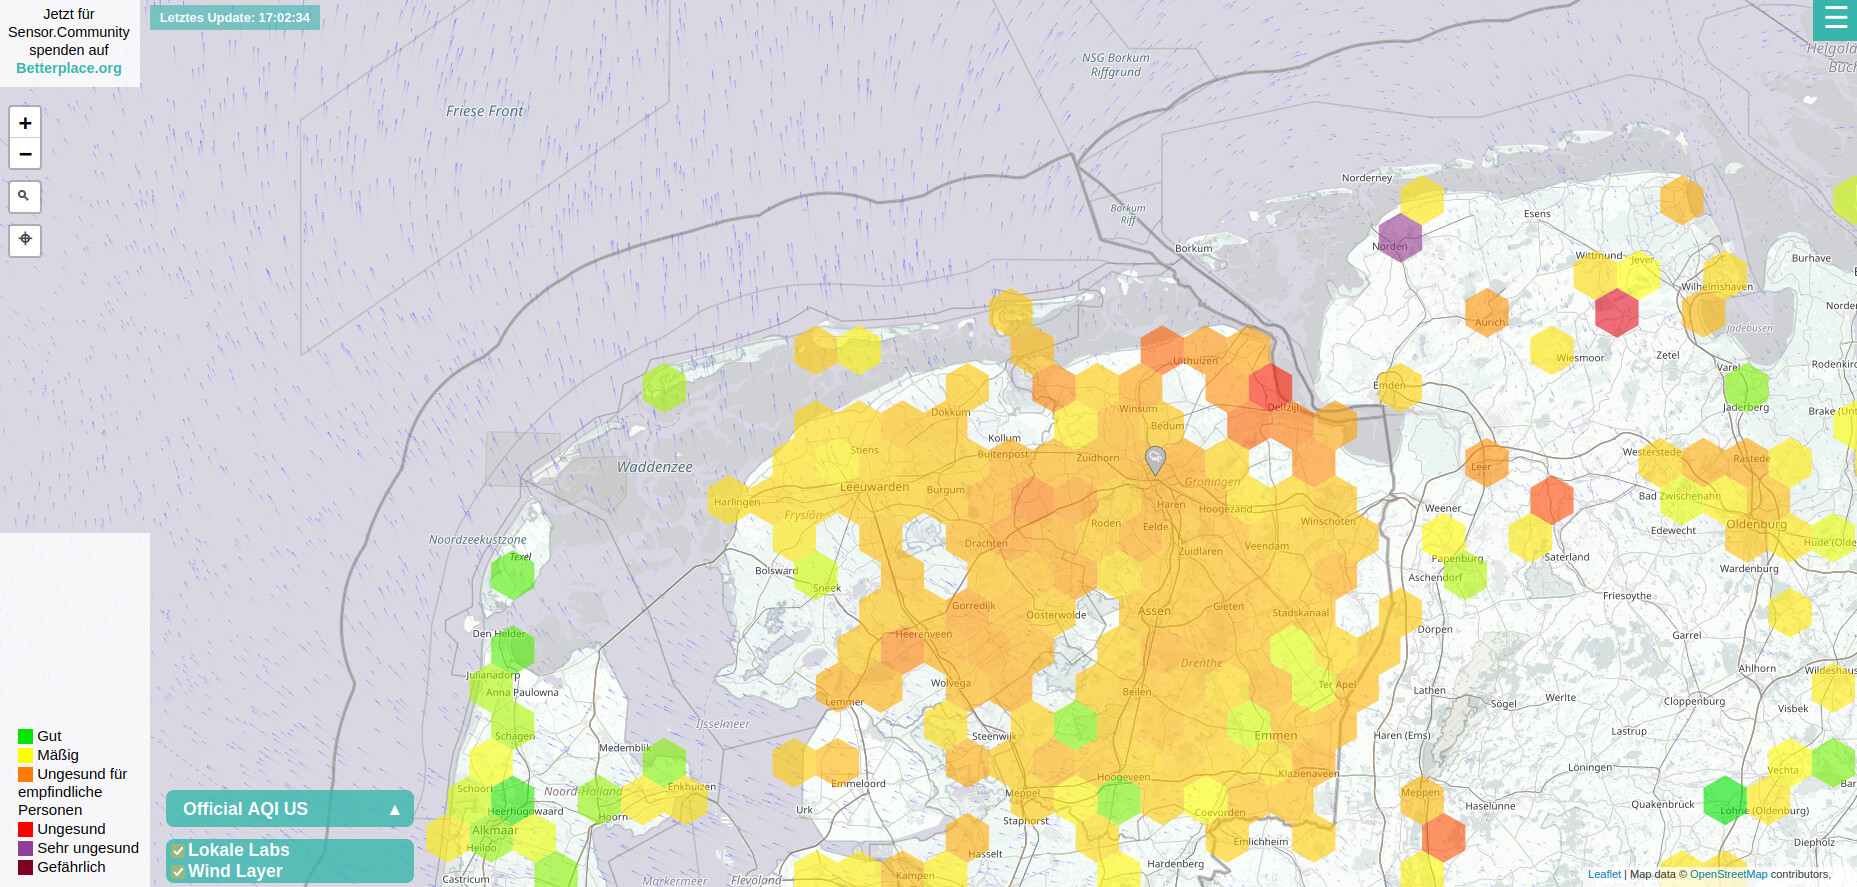
Then you switch to the AQI layer,

which shows it is unhealthy to be there for sensitive persons. So, the website makes a statement about a health effect that is based on absolute values that are wrong - maybe you have the cleanest air you can breathe in this region at the moment. For everybody who’s doing a quick check only without digging deeply into the details how everything works (which are 95% of the pages’ visitors, I assume), this can of course be frightening.

Maybe there are too many problems in this project to cope with for a proper quality management. Everybody can join in with any device whatsoever, from carefully-built with heat dryer, to completely-off and installed at the wrong place; with different sensor types from different batches, with brand-new or aged lasers, installed a few meters from the ground or at the top of a high building. But I don’t see any attempt to simply start dealing with it. E.g. one could start to contact all installations with DHT22 sensors and ask for replacement with another type. Or mark all humidity readings from stations with DHT22 as invalid. I miss a scientific approach, to identify inaccuracies and sources of errors and to deal with this. I miss at least an “official” statement to which extent false readings can be tolerated. Yes, if you have a single station that is off, it is no problem to indentify. But if a whole region is off due to the weather? You don’t know what is inside of each water droplet without drying it. PM10? PM2.5? Or simply nothing, only water? Like at the Netherlands coast yesterday?

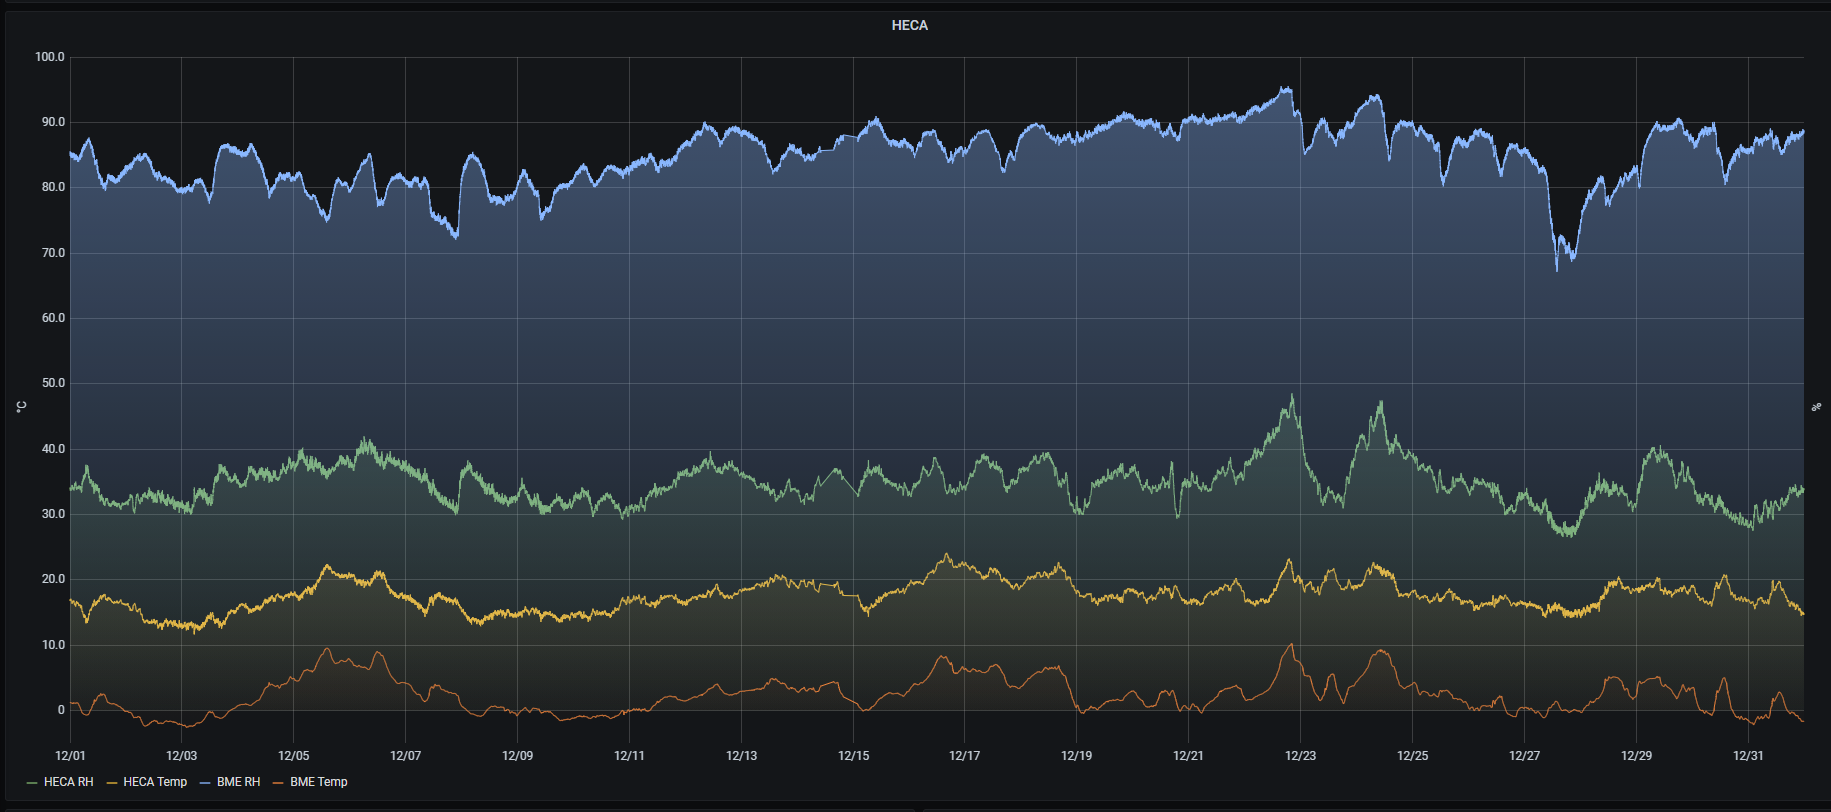
I have bought my hardware some years ago, right after the project started, but after reading the first research papers decided not to set it up due to not-yet overcome data quality and security issues. Some weeks ago I found it in a cardbox and did a research on luftdaten.info, finding papers that mathematical compensation with the help of the humidity sensor is possible. I assumed this has already been implemented, so I installed the sensor and registered it. But then I saw a huge influence of humidity on my data and spent some hours to find out if mathematical compensation has been implemented or not. It took me quite a while also to find the github repository with the source code. Deeply hidden in a forums post I found the statement that compensation algorithms have not been possible to implement.

On https://pudi.lubw.de/detailseite/-/publication/90536 [p.17] you can find that the SDS011 can overestimate PM10 more than 500%. On the same paper on p. 15 is shown that increasing the length of the pipe from 20cm to 100cm is reduces the airflow to 62% - with massive impact on the registered amount of particles of course. So, that’s quite a bit!

The more the sensors network grows, the bigger becomes the environmental impact. It’s often not into focus that electricity comes not from a wall outlet and internet data not from a magic cloud, but needs a very power consuming infrastructure in behind. According to https://www.watson.ch/digital/wissen/852678578-4-gramm-co-jedes-mail-das-du-verschickst-waermt-die-erde-auf , sending a single small email emits 4g CO2. If we say an airrohr datagram is similar to a small email, and we have 24 datagrams an hour, this is 840 kg for each station or 12.614 tons for all 15.000 stations per year. Even if it’s only 0.4g CO2 per datagram (because there is less data storage), it’s still quite a bit. Also, the production of the hardware consumes quite a bit of resources. 15.000 sensors that have to be replaced every 5-6 years?

And so, there is a question: how much resources do we want to spend for only a “picture for the media”? Or for reliable data, so a comparison with the one taken from the governments can be made? What can (and has to) be a “way in the middle”? Everything can stay like it is, thus creating only a (wrong) “picture” for the broad public during the time of the year when finedust is really a matter, and produce hundreds of tons of CO2 for it. Or produce the CO2 for creating data where at least an easy estimation of data quality is possible for everybody, even if data is wrong. Or spend it not at all during the time when data quality can not be ensured, by switching off the stations.
How valuable is this inaccurate data? For the public? For scientists? What is done with the research results of the scientists that use the inaccurate data? One can identify Tegel airport approach lane also on a dry summer day, why should one take unreliable data from a high-humidity period? Maybe it’s interesting to identify fine dust in the approach lane, not only condensed water from the engines or from some thermal effects on the wings?

NAM (https://air.nettigo.pl/baza-wiedzy/nam-033-std-fa/?setlang=en) looks quite interesting.
There has been a comparison made to certified national stations? I did not find anything about it on the web page. How has it been done? Under which different climatic conditions?

It´s an interesting approach to heat up the air during the time between the measurements, then measure the heated air. But then a precise timing is needed, as measurement has to be done not before and not after the warm air arrives and measurement time can only be very short, as the first air passing the tube will cool down immediately. You can not heat up the whole housing on cold days with only 1W to prevent this. Also, when the air is heated for 2 minutes in the chamber, this might influence the composition of the fine dust (partices may settle down or stick on the walls), as there is no air movement during this time. If there is wind outside, it may swap the air in the chamber several times during heat-up, so no reliable heating may be possible.
Also, the total consumed energy does not depend on the time but on the heated air volume, and there especially of the water content and if hygroscopic salts are dissolved into the water. You can heat it up for 1 second with 100W or for 100 seconds with 1W. Important may be thermal insulation from the environment, so the heat is kept inside the heater and not wasted.

The PTC is silver, thus it’s hard for him to emit the heat into the air, while the surrounding tube is black, thus absorbing heat easily - both heat from the outside sunlight and the PTC. The case is not naturally ventilated, so it will always have a micro climate inside, as will be in the humidity/temperature sensor, as radiation shielding is quite basic.

What I can also see, the humidity sensor is outside the case, so there is no feedback about humidity in the air stream at all, thus the PTC can not been regulated to get a continuous rH level or even know the humidity content in the air stream. Did you make your research with a second sensor at the fan exhaust?

There came a new paper “on the market” last month dealing with air preheat. They use a 10W heater with a 50cm long insulated brass tube, bringing humidity down to 35% and measuring directly inside the measurement chamber of the sensor to provide a feedback on the heating element:

https://www.researchgate.net/publication/351245900_Comparison_of_a_Computational_Method_for_Correcting_the_Humidity_Influence_with_the_Use_of_a_Low-Cost_Aerosol_Dryer_on_a_SDS011_Low-Cost_PM-Sensor

The results are pretty good but power consumption high and construction may be too hard for the basic amateur.

Cheers,

Andreas

2 Likes

PTC is not silver. It’s made of ceramic material with strong positive temperature coefficient (PTC) characteristics. Because of resistance coefficient it simply means this is self-regulating heater, and it doesn’t need any protection (it’s simply safe to use, since when powered via 5V power supply it can reach max 55°C). This PTC ceramic material is enclosed in aluminium profile (https://nettigo.pl/system/images/3111/original.jpg).

SHT30 works as temperature and humidity sensor for heating chamber. It’s placed at the top of heating chamber near tube which connect chamber with SDS011.

1 Like

If you want to cut power usage it’s quite simple

1: Remove all the status LEDS
2: Replace the LDO regulator with a Switching Regulator.

Hey @Radi,

I have actually really, really good experiences with the accuracy of these devices.

I have to say I find some of the things you say too negative. You base a lot of what you say on assumptions, e.g., in your piece about the whole North-Western part of the Netherlands. Did you compare the data with another website, for example, AirVisual, or PurpleAir? Because every time I do, when the sensor.community devices show certain values, so do thousand-dollar-worth devices - and the other way around too. Not exactly, but they are not way off.
Did you know there are many factories and there’s a lot of agriculture in the North-West of the Netherlands? I’m not saying this is what caused the readings you posted, but perhaps if you had compared them to another website with more “professional” instruments you would have seen the same. Every time I do, I only find -not exactly the same!- but very similar results on other websites.

I live in Almaty, Kazakhstan, I have three (yes three!) sensors, and they are always on par with devices from, say, the American embassy (who have a professional grade instrument) and my work’s (where we use an AirVisual device from ~€300).

Yes, the exact PM2.5 value is often different (if only a little bit). Sometimes it’s a bit higher, sometimes a bit lower. The PM10 value is often even more off. But when the air quality is bad here (which it gets in winter) it shows this on all these devices, expensive or “cheap” SDS011.

To my best knowledge, this project does not aim to provide exact data, but an general overview of where the air quality is good, or not so good, or downright bad - so that we can investigate those areas more carefully and try to determine a cause. So, yes, due to the use of relatively cheap equipment, probably the data will occasionally be off, maybe even more than a little, although this is not my experience at all.

I just wanted to say I thought your comments are very negative and I don’t agree that values that are a little bit off are a big problem, and I have never found them to be off more than a little bit.

I’m sure you mean well, and I do see some truth in your comments re: power consumption and the use of keeping that low, but for a project that solely relies on volunteers and people doing this in their own time I am well impressed with what has already been achieved.

Cheers,

Maarten

Just putting this here. I’d totally agree with their assessment that the PM2.5 readings are more reliable than the PM10 readings.

Hi Maarten,

yes I agree that my comment had some negativity in it. And I am a little sorry about it, because I know there is a lot of “heartblood” in it from volunteers spending time for it.

There are many scientific papers out there that show the limitations of these sensors, and this is not a prolem in itself, when the limitations are named and made visible, so that everyone who has access to the data can see them without further reading into the details. And this is what I find is missing here. Everything looks so well, you take it for truth but maybe it is not. Maybe you have winter and get high readings, and the air quality is indeed bad, but it’s a difference if the sensor detects the fine dust or the small water droplets. Both come toether in this kind of weather. When everybody can smell bad air, you don’t need a sensor. You need it when you think air is OK but it is not.

A simple improvement would be to have PM and humidity curves overlayed. But they are on different pages. Even better would be to mark probably invalid data, e.g. with error bars.
Did you know that none of these cheap sensors can in fact measure PM10? It’s estimated from the PM2.5 value.

My comment was meant as a provocation. But I still think it’s important to say that on all the things we’re doing we should make an assessment between the benefits and the costs. The benefit in this case is bringing the problem of fine dust into public (not: providing reliable data!). The costs are high energy footprint due to power consumption and production and disposal of tons of electronics.
There are a lot of very well meant research projects that in fact increase the destruction of this planet. It’s much more difficult to dispense with some fancy idea, than to start something that looks quite nice but in fact does not work too well when observed in detail. And it’s much easier to install a fine dust sensor (and feel good) than to quit driving an own car. (Sorry for being so provocative and negative again… :slight_smile:

1 Like