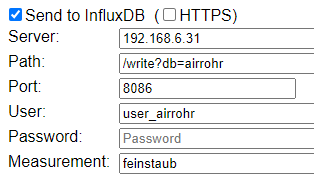
Sure, here’s my dashboard config file (I can’t upload the .json file, so I’ll try and post it here). I think you can just import it and change the queries to represent your sensor’s id.
The main.json file
[
{
"apiVersion": "influxdata.com/v2alpha1",
"kind": "Dashboard",
"metadata": {
"name": "elastic-shtern-433001"
},
"spec": {
"charts": [
{
"axes": [
{
"base": "10",
"name": "x",
"scale": "linear"
},
{
"base": "10",
"name": "y",
"scale": "linear",
"suffix": "°C"
}
],
"colorizeRows": true,
"colors": [
{
"id": "CPf9stCk76p_J_BoXTHF_",
"name": "Nineteen Eighty Four",
"type": "scale",
"hex": "#31C0F6"
},
{
"id": "l3oN_vVowx4hW8z7HqlZ_",
"name": "Nineteen Eighty Four",
"type": "scale",
"hex": "#A500A5"
},
{
"id": "suIRCu3qDXlSbL6wYA2eK",
"name": "Nineteen Eighty Four",
"type": "scale",
"hex": "#FF7E27"
}
],
"geom": "line",
"height": 4,
"hoverDimension": "auto",
"kind": "Xy",
"legendColorizeRows": true,
"legendOpacity": 1,
"legendOrientationThreshold": 100000000,
"name": "24hr Temp",
"opacity": 1,
"orientationThreshold": 100000000,
"position": "overlaid",
"queries": [
{
"query": "from(bucket: \"influx\")\n |> range(start: -24h, stop: v.timeRangeStop)\n |> filter(fn: (r) => r[\"_measurement\"] == \"feinstaub\")\n |> filter(fn: (r) => r[\"_field\"] == \"BME280_temperature\")\n |> filter(fn: (r) => r[\"node\"] == \"esp8266-15514816\")\n |> aggregateWindow(every: 3m, fn: mean, createEmpty: false)\n |> yield(name: \"mean\")"
}
],
"staticLegend": {
"colorizeRows": true,
"opacity": 1,
"orientationThreshold": 100000000,
"widthRatio": 1
},
"width": 6,
"widthRatio": 1,
"xCol": "_time",
"yCol": "_value"
},
{
"colors": [
{
"id": "0",
"name": "pool",
"type": "min",
"hex": "#22ADF6",
"value": 20
},
{
"id": "TA9HqluhULEZP_tLBEfYA",
"name": "honeydew",
"type": "threshold",
"hex": "#7CE490",
"value": 22
},
{
"id": "sjZO0p4Z3lMdMvWrFkosS",
"name": "thunder",
"type": "threshold",
"hex": "#FFD255",
"value": 27
},
{
"id": "-S9MBJwj1_-KODoMKN86Z",
"name": "pineapple",
"type": "threshold",
"hex": "#FFB94A",
"value": 28.5
},
{
"id": "jSHrGf1WhofiqzJlGJn9U",
"name": "tiger",
"type": "threshold",
"hex": "#F48D38",
"value": 31
},
{
"id": "CT7aHfsgBKHtZ_xG8t-PH",
"name": "curacao",
"type": "threshold",
"hex": "#F95F53",
"value": 33
},
{
"id": "1",
"name": "comet",
"type": "max",
"hex": "#9394FF",
"value": 35
}
],
"decimalPlaces": 2,
"height": 5,
"kind": "Gauge",
"name": "temp gauge",
"queries": [
{
"query": "from(bucket: \"influx\")\n |> range(start: v.timeRangeStart, stop: v.timeRangeStop)\n |> filter(fn: (r) => r[\"_measurement\"] == \"feinstaub\")\n |> filter(fn: (r) => r[\"_field\"] == \"BME280_temperature\")\n |> filter(fn: (r) => r[\"node\"] == \"esp8266-15514816\")\n |> aggregateWindow(every: v.windowPeriod, fn: mean, createEmpty: false)\n |> yield(name: \"mean\")"
}
],
"staticLegend": {},
"suffix": "°C",
"width": 3,
"yPos": 4
},
{
"axes": [
{
"name": "x",
"scale": "linear"
},
{
"name": "y",
"scale": "linear",
"suffix": "%"
}
],
"colorizeRows": true,
"colors": [
{
"id": "EclyiLoTHdQDfhpQR2NyT",
"name": "Cthulhu",
"type": "scale",
"hex": "#FDC44F"
},
{
"id": "BZ-D8AreuWzQqOtndOfge",
"name": "Cthulhu",
"type": "scale",
"hex": "#007C76"
},
{
"id": "6j-eax57khgmTbE7AHg7_",
"name": "Cthulhu",
"type": "scale",
"hex": "#8983FF"
}
],
"geom": "monotoneX",
"height": 5,
"heightRatio": 0.11,
"hoverDimension": "xy",
"kind": "Band",
"legendColorizeRows": true,
"legendOpacity": 1,
"legendOrientationThreshold": -1,
"mainColumn": "mean",
"name": "Last 2 days humidity",
"opacity": 1,
"orientationThreshold": 100000000,
"queries": [
{
"query": "import \"math\"\nimport \"date\"\n\nfrom(bucket: \"influx\")\n |> range(start: -2d, stop: date.truncate(t: now(), unit:15m))\n |> filter(fn: (r) => r[\"_measurement\"] == \"feinstaub\")\n |> filter(fn: (r) => r[\"_field\"] == \"BME280_humidity\")\n |> filter(fn: (r) => r[\"node\"] == \"esp8266-15514816\")\n |> aggregateWindow(every: 5m, fn: mean, createEmpty: false)\n |> timeShift(duration: -15m)\n |> yield(name: \"mean\")"
}
],
"staticLegend": {
"colorizeRows": true,
"heightRatio": 0.11,
"opacity": 1,
"orientationThreshold": 100000000,
"widthRatio": 1
},
"width": 6,
"widthRatio": 1,
"xCol": "_time",
"yCol": "_value",
"yPos": 9
},
{
"colors": [
{
"id": "0",
"name": "fire",
"type": "min",
"hex": "#DC4E58"
},
{
"id": "TA9HqluhULEZP_tLBEfYA",
"name": "honeydew",
"type": "threshold",
"hex": "#7CE490",
"value": 40
},
{
"id": "cJQswBeD1cX5gRH_GKkdm",
"name": "ocean",
"type": "threshold",
"hex": "#4591ED",
"value": 60
},
{
"id": "1",
"name": "ocean",
"type": "max",
"hex": "#4591ED",
"value": 100
}
],
"decimalPlaces": 0,
"height": 5,
"kind": "Gauge",
"name": "humidity gauge",
"queries": [
{
"query": "from(bucket: \"influx\")\n |> range(start: v.timeRangeStart, stop: v.timeRangeStop)\n |> filter(fn: (r) => r[\"_measurement\"] == \"feinstaub\")\n |> filter(fn: (r) => r[\"_field\"] == \"BME280_humidity\")\n |> filter(fn: (r) => r[\"node\"] == \"esp8266-15514816\")\n |> aggregateWindow(every: v.windowPeriod, fn: mean, createEmpty: false)\n |> yield(name: \"mean\")"
}
],
"staticLegend": {},
"suffix": "%",
"width": 3,
"xPos": 3,
"yPos": 4
},
{
"axes": [
{
"base": "10",
"name": "x",
"scale": "linear"
},
{
"base": "10",
"name": "y",
"scale": "linear",
"suffix": "μg/m³"
}
],
"colorizeRows": true,
"colors": [
{
"id": "CPf9stCk76p_J_BoXTHF_",
"name": "Nineteen Eighty Four",
"type": "scale",
"hex": "#31C0F6"
},
{
"id": "l3oN_vVowx4hW8z7HqlZ_",
"name": "Nineteen Eighty Four",
"type": "scale",
"hex": "#A500A5"
},
{
"id": "suIRCu3qDXlSbL6wYA2eK",
"name": "Nineteen Eighty Four",
"type": "scale",
"hex": "#FF7E27"
}
],
"geom": "line",
"height": 4,
"hoverDimension": "auto",
"kind": "Xy",
"legendColorizeRows": true,
"legendOpacity": 1,
"legendOrientationThreshold": 100000000,
"name": "24hr PM",
"opacity": 1,
"orientationThreshold": 100000000,
"position": "overlaid",
"queries": [
{
"query": "from(bucket: \"influx\")\n |> range(start: -24h, stop: v.timeRangeStop)\n |> filter(fn: (r) => r[\"_measurement\"] == \"feinstaub\")\n |> filter(fn: (r) => r[\"_field\"] == \"SDS_P1\" or r[\"_field\"] == \"SDS_P2\")\n |> filter(fn: (r) => r[\"node\"] == \"esp8266-15514816\")\n |> aggregateWindow(every: 3m, fn: mean, createEmpty: false)\n |> yield(name: \"mean\")"
}
],
"staticLegend": {
"colorizeRows": true,
"opacity": 1,
"orientationThreshold": 100000000,
"widthRatio": 1
},
"width": 6,
"widthRatio": 1,
"xCol": "_time",
"xPos": 6,
"yCol": "_value"
},
{
"colors": [
{
"id": "base",
"name": "laser",
"type": "text",
"hex": "#00C9FF"
}
],
"decimalPlaces": 2,
"height": 1,
"kind": "Single_Stat",
"name": "Current Temp",
"queries": [
{
"query": "from(bucket: \"influx\")\n |> range(start: v.timeRangeStart, stop: v.timeRangeStop)\n |> filter(fn: (r) => r[\"_measurement\"] == \"feinstaub\")\n |> filter(fn: (r) => r[\"_field\"] == \"BME280_temperature\")\n |> filter(fn: (r) => r[\"node\"] == \"esp8266-15514816\")\n |> aggregateWindow(every: v.windowPeriod, fn: mean, createEmpty: false)\n |> yield(name: \"mean\")"
}
],
"staticLegend": {},
"suffix": "°C",
"width": 3,
"xPos": 6,
"yPos": 4
},
{
"colors": [
{
"id": "0",
"name": "honeydew",
"type": "min",
"hex": "#7CE490"
},
{
"id": "1",
"name": "curacao",
"type": "max",
"hex": "#F95F53",
"value": 15
}
],
"decimalPlaces": 2,
"height": 4,
"kind": "Gauge",
"name": "PM-10 Air Quality Gauge",
"prefix": " ",
"queries": [
{
"query": "from(bucket: \"influx\")\n |> range(start: v.timeRangeStart, stop: v.timeRangeStop)\n |> filter(fn: (r) => r[\"_measurement\"] == \"feinstaub\")\n |> filter(fn: (r) => r[\"_field\"] == \"SDS_P1\")\n |> filter(fn: (r) => r[\"node\"] == \"esp8266-15514816\")\n |> aggregateWindow(every: v.windowPeriod, fn: mean, createEmpty: false)\n |> yield(name: \"mean\")"
}
],
"staticLegend": {},
"suffix": "μg/m³",
"width": 3,
"xPos": 6,
"yPos": 5
},
{
"axes": [
{
"name": "x",
"scale": "linear"
},
{
"name": "y",
"scale": "linear",
"suffix": "°C"
}
],
"colorizeRows": true,
"colors": [
{
"id": "CWfM8KSk0KcJAoLDskliB",
"name": "Nineteen Eighty Four",
"type": "scale",
"hex": "#31C0F6"
},
{
"id": "RFJ2YvTqJpWNekKgVoFP-",
"name": "Nineteen Eighty Four",
"type": "scale",
"hex": "#A500A5"
},
{
"id": "4_LFQM31KEvV4uJI0sAor",
"name": "Nineteen Eighty Four",
"type": "scale",
"hex": "#FF7E27"
}
],
"geom": "line",
"height": 5,
"hoverDimension": "auto",
"kind": "Band",
"legendColorizeRows": true,
"legendOpacity": 1,
"legendOrientationThreshold": 100000000,
"mainColumn": "mean",
"name": "Last 7 days temp",
"opacity": 1,
"orientationThreshold": 100000000,
"queries": [
{
"query": "import \"math\"\nimport \"date\"\n\nfrom(bucket: \"influx\")\n |> range(start: -7d, stop: date.truncate(t: now(), unit:30m))\n |> filter(fn: (r) => r[\"_measurement\"] == \"feinstaub\")\n |> filter(fn: (r) => r[\"_field\"] == \"BME280_temperature\")\n |> filter(fn: (r) => r[\"node\"] == \"esp8266-15514816\")\n |> aggregateWindow(every: 30m, fn: mean, createEmpty: false)\n |> map(fn: (r) => ({r with _value: math.round(x: (r._value * 10.0)) / 10.0}))\n |> timeShift(duration: -30m)\n |> yield(name: \"mean\")"
}
],
"staticLegend": {
"colorizeRows": true,
"opacity": 1,
"orientationThreshold": 100000000,
"widthRatio": 1
},
"width": 6,
"widthRatio": 1,
"xCol": "_time",
"xPos": 6,
"yCol": "_value",
"yPos": 9
},
{
"colors": [
{
"id": "base",
"name": "laser",
"type": "text",
"hex": "#00C9FF"
}
],
"decimalPlaces": 2,
"height": 1,
"kind": "Single_Stat",
"name": "Current Humidity",
"queries": [
{
"query": "from(bucket: \"influx\")\n |> range(start: v.timeRangeStart, stop: v.timeRangeStop)\n |> filter(fn: (r) => r[\"_measurement\"] == \"feinstaub\")\n |> filter(fn: (r) => r[\"_field\"] == \"BME280_humidity\")\n |> filter(fn: (r) => r[\"node\"] == \"esp8266-15514816\")\n |> aggregateWindow(every: v.windowPeriod, fn: mean, createEmpty: false)\n |> yield(name: \"mean\")"
}
],
"staticLegend": {},
"suffix": "%",
"width": 3,
"xPos": 9,
"yPos": 4
},
{
"colors": [
{
"id": "0",
"name": "honeydew",
"type": "min",
"hex": "#7CE490"
},
{
"id": "1",
"name": "curacao",
"type": "max",
"hex": "#F95F53",
"value": 5
}
],
"decimalPlaces": 2,
"height": 4,
"kind": "Gauge",
"name": "PM-2.5 Air Quality Gauge",
"prefix": " ",
"queries": [
{
"query": "from(bucket: \"influx\")\n |> range(start: v.timeRangeStart, stop: v.timeRangeStop)\n |> filter(fn: (r) => r[\"_measurement\"] == \"feinstaub\")\n |> filter(fn: (r) => r[\"_field\"] == \"SDS_P2\")\n |> filter(fn: (r) => r[\"node\"] == \"esp8266-15514816\")\n |> aggregateWindow(every: v.windowPeriod, fn: mean, createEmpty: false)\n |> yield(name: \"mean\")"
}
],
"staticLegend": {},
"suffix": "μg/m³",
"width": 3,
"xPos": 9,
"yPos": 5
}
],
"name": "Main"
}
}
]
Influxdb has a GUI that lets you add these charts, I think it calls it ‘cells’. All the charts were made using that, except for the last one.