Many members of the community are exploiting their sensors (data recovery, plotting, scientific comparison…) but what do they do with their results? Some are publishing papers (very interesting sources mentioned through the community) but are some publishing investigations on pollution measurements on given areas through a web site or other wide public means?
Does someone has an experience or feedback on such approach?
I do some analysis for VGA in Marmande.
Check the Start up Hyzone and contact them to get some example.
Most users choose sensor.community because it is easy and cheap to get a sensor running and showing data on a map, however, as you mention, the next step is a big hurdle for most as it involves programming knowledge which most users do not have.
Back in 2020 here in Best (NL) we started with initially 20 sensors, increased to 50 early 2021 to find out if we could find and distinguish village external pollution sources from village internal ones. Initially it was nice to see all sensors on the map and while watching the screen one could see ‘things happening’ every now and then. But that was not what we were looking for.
We had to find a way to have the map look back in time so we would be able to dynamically see pollution events like a fire or a big BBQ behave.
Second problem was the cheap SDS011 PM sensors (and others) are not calibrated on low ranges so their low measurement values differ with the same input signal making it difficult to reliably see local dynamic changes caused by e.g. wood stoves.
As for the historical view part, I initially used a raspberry PI to call up a fixed maps.sensor.community map of our village and make a screen print every 5 minutes and combined these screen shots into a video, which worked but was cumbersome.
Fed up with this all I wrote a functional spec on how I would like to have a website showing our village map should function to allow viewers to go back in time end run a time-line ‘video’ showing dynamic sensor colour changes helping to find pollution sources.
Second part of this spec contained a way to correct sensor measurement values before they were displayed on the map (Y=AX+B) where A and B could be set for every individual sensor and X is the raw sensor.community measurement value.
All the above means sensor.community measurement data is to be copied into a separate database into which weather data is also added as well as data from 3 specific TNO sensors, part of Meetnet Eindhoven. These 3 TNO sensors are considered ‘reference’ and used as a basis to correct our cheap sensors.
It has taken a long time to get this going but thanks to financial support from gemeente Best we are almost there to have this website up and running and start our effort to slowly improve measurement results and find out if this concept actually works.
For the inhabitants of Best it will help to get a better insight into the PM air quality in Best and what happens if they throw on their wood stoves on a chilly evening.
Hello Peoter
Thank you for this reply; it is comforting to see that some of us have the same ambition.
I am living near Toulouse (France) and we have more than 30 sensors in and around Toulouse and 12 official air quality measurement stations. So we have a lot of data we can cross to draw an interesting air quality map in various areas. I went through the same concerns as you: calibration of the community sensors between them and with respect to the official sensors, correction of the measurements with respect to some impacting factors (ex: low temperature as I noticed a significant drift particularly in winter… but not related to humidity factor !), plotting data on curves over a certain period, comparing values with recommended thresholds, doing dynamic video animations showing results over the region. Astonishingly, we can drive coherent information between all sensors (low cost and high cost) and the next step is how to share this on a large scale population and with which objective. As you, I am trying to build a web site to interact with the local actors. Beyond the technical aspects (through the sensor measurements) the psychological approach is a major driver to make people sensitive we need also to address at the same time; some initiatives on this topic are starting in Toulouse we shall cooperate with.
Hope to read you and exchange on the future steps of these initiatives.
Chris
1 Like
Hi, I too am trying to compare output from the sensor community sensors and reference systems. It is early days and I am trying to compare our pm2.5 measurements with a calculated pm2.5 value from TEOM PM10 readings. So far I am not finding a good correlation. I would be interested in your data.
Hello
Here is an example of comparison between official sensor (Atmo) and SDS011 sensor.
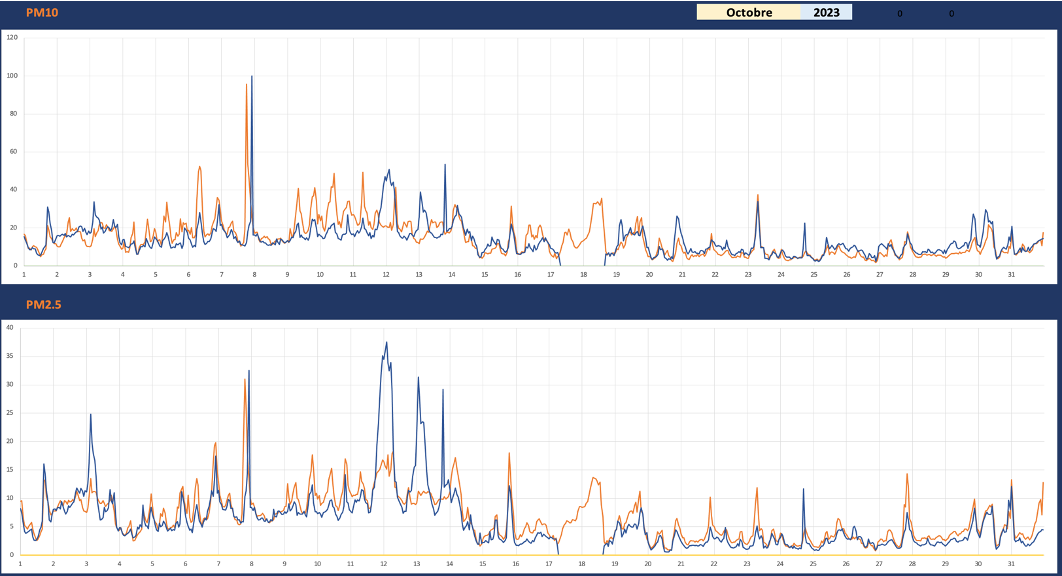
There are located close together but not exactly at the same place in Toulouse (F); the correlation is quite good. To do this comparison the SDS sensor is calibrated to compensated the non setup after its fabrication. There are some small differences; the TOEM is measuring particule mass, whereas the SDS is measuring a number of particules. Consequently the measurements may differ in the period when the composition of the flux changes (ex: on the 12th and 13th October). The correlation is better for PM2.5 than for PM10.
However the behavior is pertinent to make trends analysis and to compare the environment at different locations.
Same trend is seen on other pair of sensors.
1 Like
Sorry; blue is the SDS sensor, red the official one.
1 Like
Thank you. Am I correct in assuming that the ATMO is a commercial off the shelf device by AtmoTube? If so, I too have found good agreement between these sensors so that is good news. I agree there are differences between the types of measurement between a TEOM and our sensors. However, I was anticipating that more general trends would be seen in both. That is the trend of the average annual concentration. In my location this has reduced for PM2.5 measured by our sensors. The TEOM PM10 concentration has however, remained the same. I therefore anticipate that the PM2.5 TEOM value calculated from the PM10 won’t have changed much (I am waiting on the conversion value to be published). So if the TEOM data doesn’t show a reduction in PM2.5 data then, which one is correct and why is there a difference? I am not certain I trust the PM10 data from the SDS011s so I haven’t used it but it might be interesting to see what that comes up with. I will investigate that.
Sorry for the confusion, but ATMO for me is the name of a certified organization in France in charge of the air quality measurement; their results are public and accessible and can then be considered as a reliable reference to compare the performance of various sensors. They use quite complex and costly stations. The PM measurements rely on TOEM sensors. You can find more information on their site (unfortunately in French): https://www.atmo-france.org . There is also a dedicated site per region (ex: Occitanie | ATMO Occitanie) They also publish average annual concentration for PM10 and PM2.5 in particular:
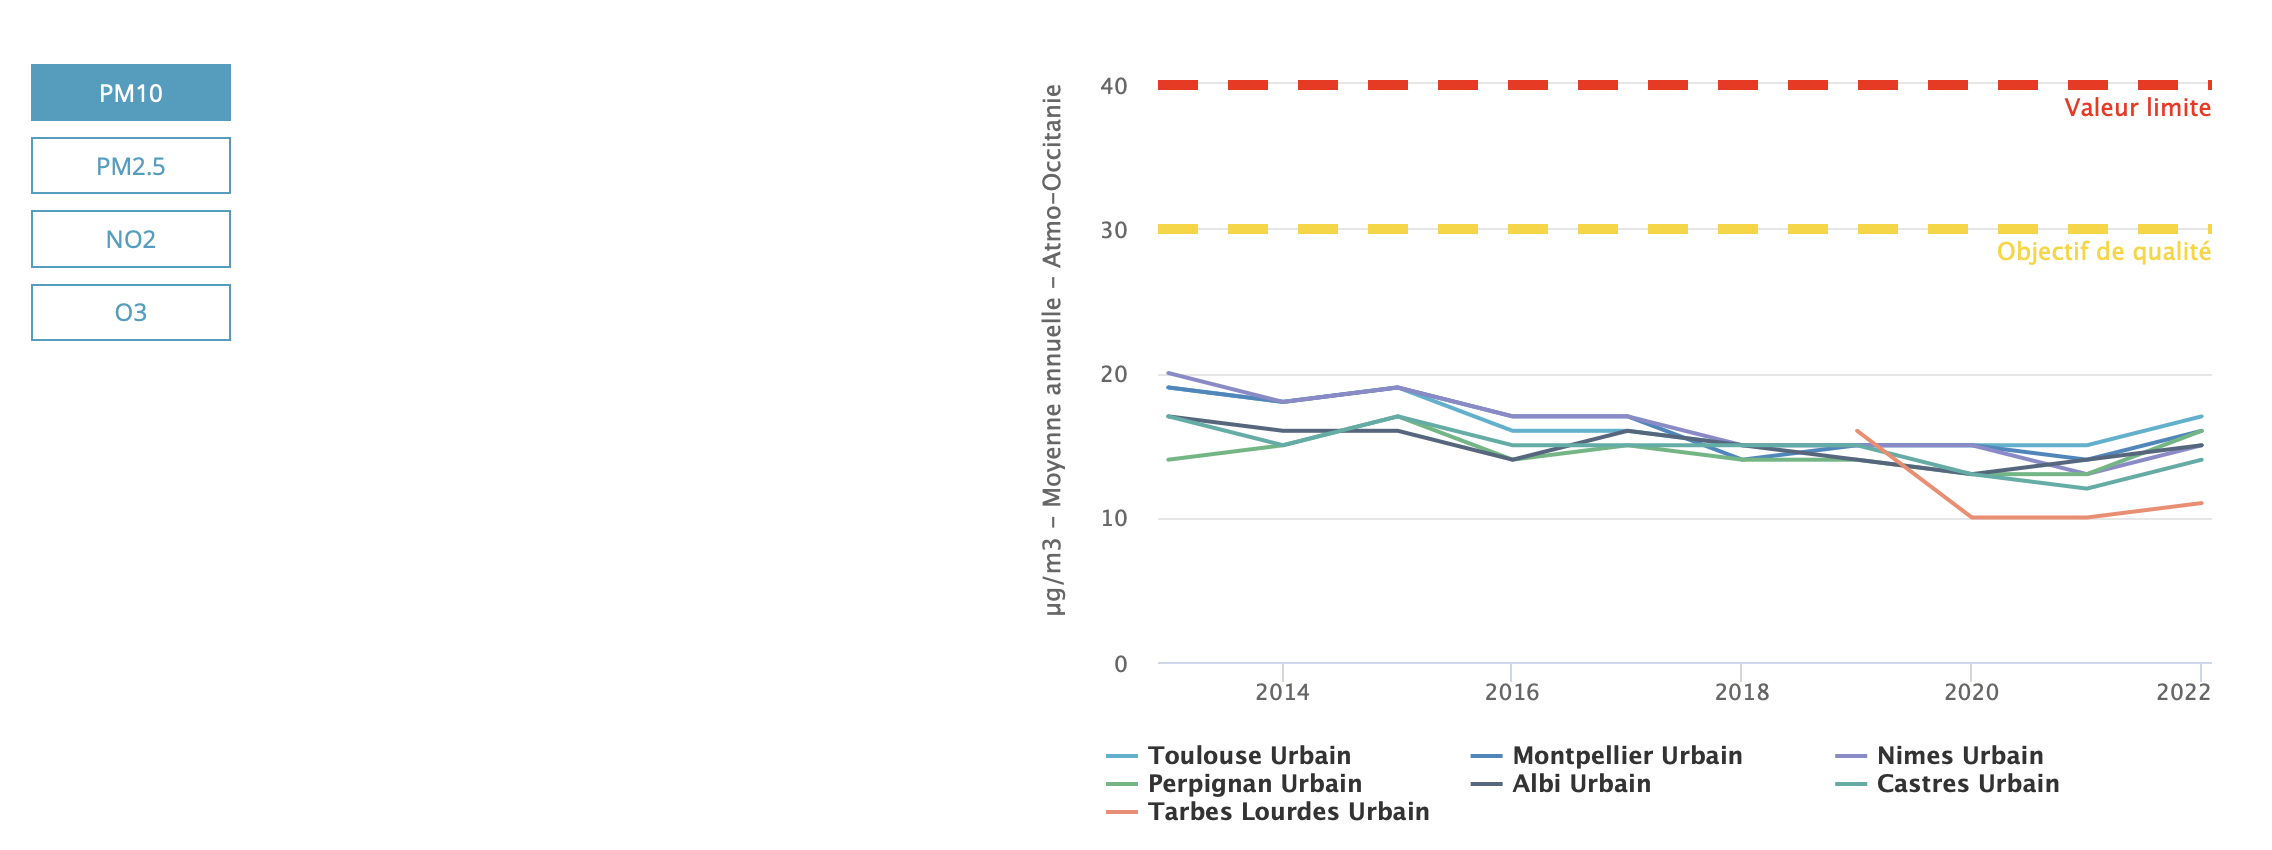
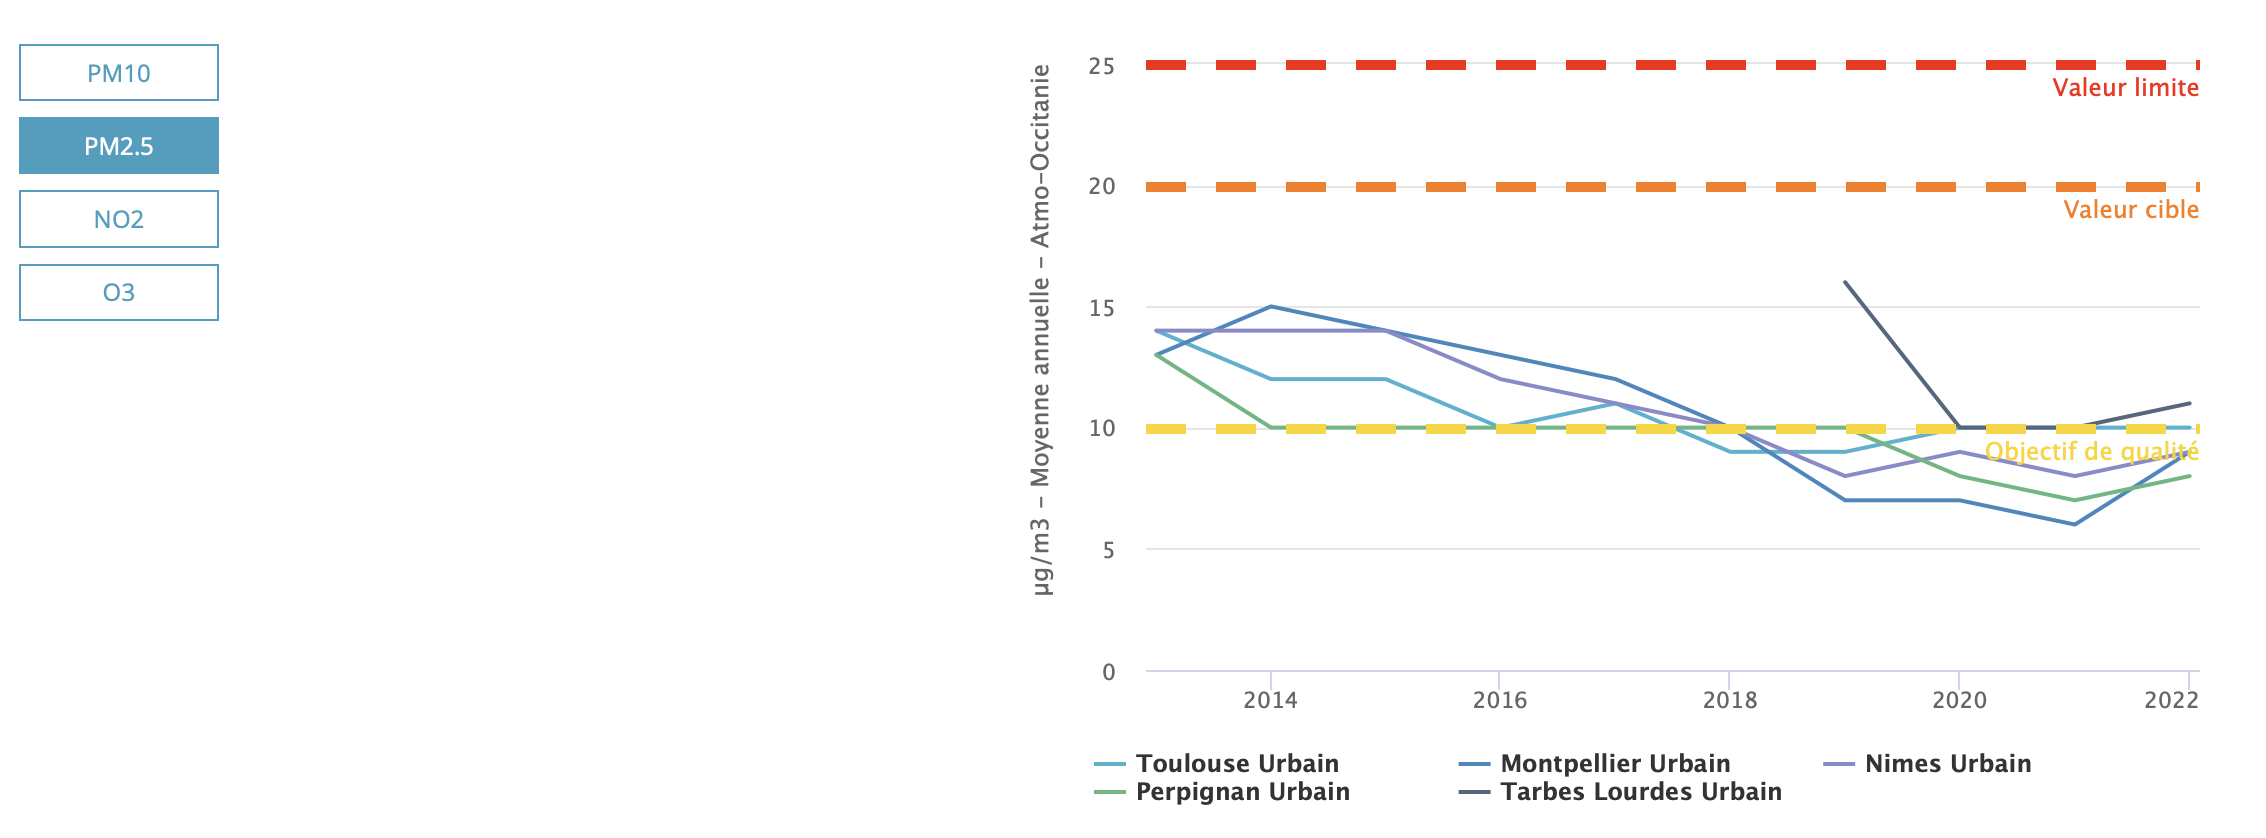
But it is difficult to anticipate any correlation between PM10 and PM2.5.
So these data are interesting for us by checking if the trend (over a month in particular) seen by a SDS011 sensor is coherent with the one shown by the ATMO measurements at the same place.
And so my answer to Peoter.
1 Like
Thank you! This is very helpful.
Hello Peoter,
Since our last discussion on this topic, I have worked on a solution to display the results of a series of sensors over a dedicated region.
So you can consult www.deciphair.com for that. Is your web site on a similar initiative operating?
What can we share from this experience? Is your local council interested by this publication?
1 Like
Thank you for posting this. Your website is very good. Currently, I only post the Sensor Community link to my area on our website. That way everyone can find what the air is like in real time, but it would be good to post monthly averages. I think I will try and do that.
We have used the sensor community map screenshots to produce a video of a larger area, which was interesting to watch. Perhaps I could do that for my local sensors.