nari
February 11, 2023, 12:21pm
1
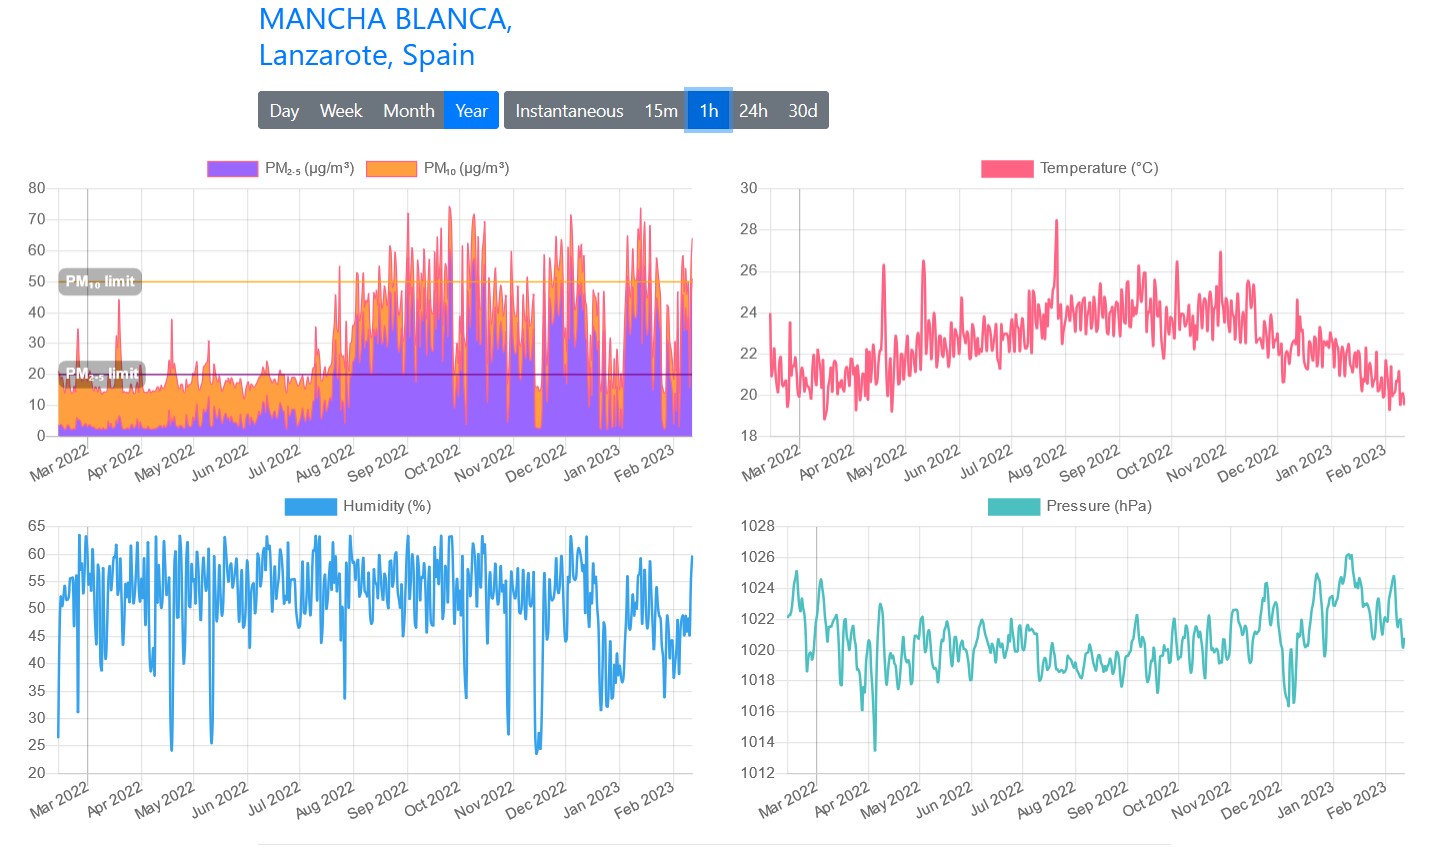
I´m running a couple of sensors (PM , Temp , Hum) for more than a year. Is there any way to shift the visualization starting date, say 16Dec2022 ?
pjg
February 11, 2023, 6:08pm
2
You will have to script the archive.
Have you tried to open the link?
Days:
[Capture d’écran 2021-02-17 à 22.32.13]
Unique sensors (with ID of the map):
[Capture d’écran 2021-02-17 à 22.33.39]
Such link downloads a csv which you can open in Excel:
https://archive.sensor.community/2021-02-16/2021-02-16_sds011_sensor_9563.csv
sensor_id;sensor_type;location;lat;lon;timestamp;P1;durP1;ratioP1;P2;durP2;ratioP2 9563;SDS011;4820;50.870;4.702;2021-02-16T00:02:05;13.15;;;8.20;; 9563;SDS011;4820;50.870;4.702;2021-02-16T00:04:31;1…
or
I don’t think the FTP access is allowed for security reasons but you can script like this:
`
import requests
#Sensor IDs separated with comma
sensor_id = []
#Dates with format 'YYYY-MM-DD' separated with comma
dates = []
url_deb = 'https://archive.sensor.community/'
for n1 in range(0,len(dates)):
date = dates[n1]
url_ok = url_deb + date
r1 = requests.get(url_ok)
source_code = r1.text
for n2 in range(0,len(sensor_id)):
test = 'sensor_'+str(sensor_id[n2])+'.csv'
…