Hello everybody from Mallorca, where we have recently set up a network of sensors in the town of Sóller. I’m looking forward to learning lots and, eventually, helping others. Perhaps somebody can help me today, though.
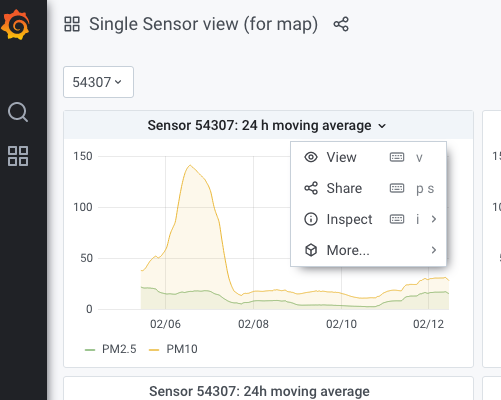
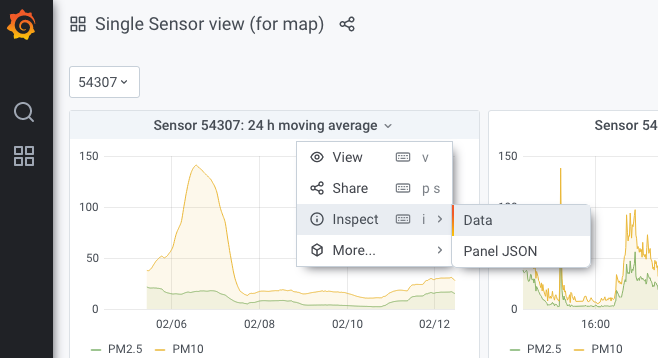
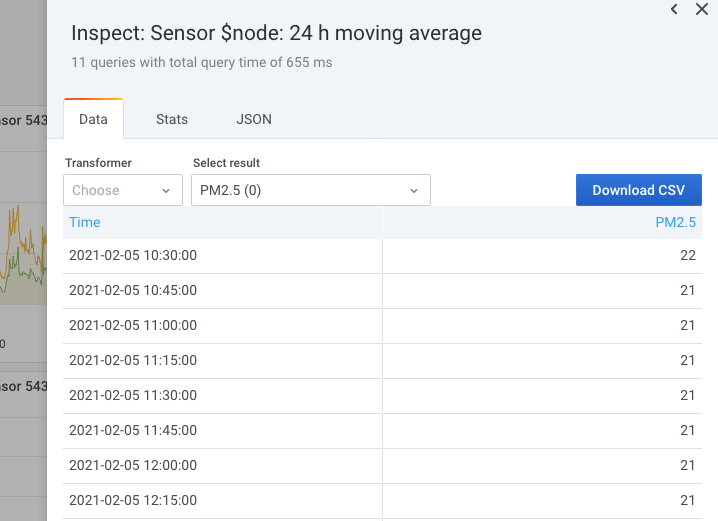
Given that the sensor ID on the map is not the same as the Chip ID (the one that begins with esp8266, for example), is there any way I can access the very useful information on the Grafana dashboard without knowing the Chip ID? For example, I’d like to inspect and download data for certain time frames from sensors that I don’t control in nearby towns for comparative purposes. I’d also like to build iframes for them to put them on our website (for example: Grafana).
But I don’t think I can do this without knowing the Chip ID (in this case [esp8266-786206])
Of course, I can access these sensors at the archive of sensor community. But I haven’t found an easy way to compile monthly data for a sensor from there, like I can do via the Grafana dashboard.
I wrote a python script for exporting from the archives:
import requests
#Put the map ID in the array separated with comma
sensor_id = ["54307"]
#Date in format 'YYYY-MM-DD' separated with comma. You can produce the list easily with Excel
dates = ["2019-01-01","2019-01-02","2019-01-03","2019-01-04","2019-01-05","2019-01-06","2019-01-07","2019-01-08","2019-01-09","2019-01-10","2019-01-11","2019-01-12","2019-01-13","2019-01-14"]
url_deb = 'http://archive.sensor.community/'

for n1 in range(0,len(dates)):

date = dates[n1]
url_ok = url_deb + date
r1 = requests.get(url_ok)
source_code = r1.text

for n2 in range(0,len(sensor_id)):

    test = 'sensor_'+sensor_id[n2]+'.csv'

    if test in source_code:

        split1 = source_code.split(test)[0]
        split2 = split1.split('<a href="')[-1]
        url_fin = url_ok + '/' + split2 + test
        #print(url_fin)
        r2 = requests.get(url_fin)
        data = r2.text
        #Print the data in terminal. You can then copy/paste in Excel
        print(data)
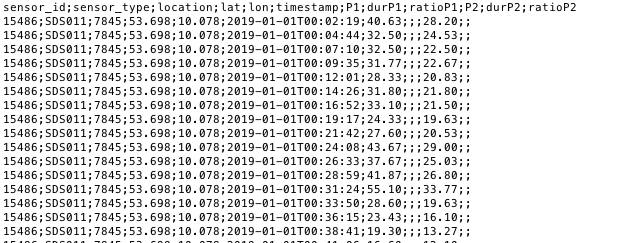
It should still work and produce something like that:
Hi Pjg.
Thanks so much for taking the time to answer. I suppose I’m looking for a mode that combines these! I’ve used both for different purposes.
It’s easy to get the var-node from the map, but it doesn’t behave like the var-chipID=esp8266. I’ve tried pasting the var-node into various parts of the address I use for my own sensors, but it doesn’t work! I suppose what I’m asking is if there is any way to open up the world of possibilities on the grafana dashboard if I only know the var-node…
I’m pretty new to all this, so I’ll have to look up how to use python and then putvtonuse the code you kindly shared. Right now I wouldn’t know where to put it!
Thanks again,
Barry.
Use those number and you’ll get exactly what you have in your internet site. Just contact me per email (pierre_jean@…) and we can plan a videocall. Because it is a lot easier as you think.
Dear Pierre.
Thank you so much. That’s what I was trying to get, or I’m 90% there now. I will play with it tomorrow and let you know. Once again, thanks. Have a great weekend, with lots of fresh air!
Regards from Mallorca.
Barry
Sorry for the beginners question - how can I change the view from let’s say 24 hrs to 1 hour etc in the overview ? I found the dropdown box, but it does not update even I press refresh?