I already sent an email to the sensor.community support, but got no answer. Has anyone achieved this? I would probably use Matlab for plotting. Any ideas on where to host this data for the Wiki as well?
Best regards
Hans
EDIT:
I have seen this: https://archive.sensor.community/ but I don’t want to download 365 individual files. Is there no way to aggregate this info?
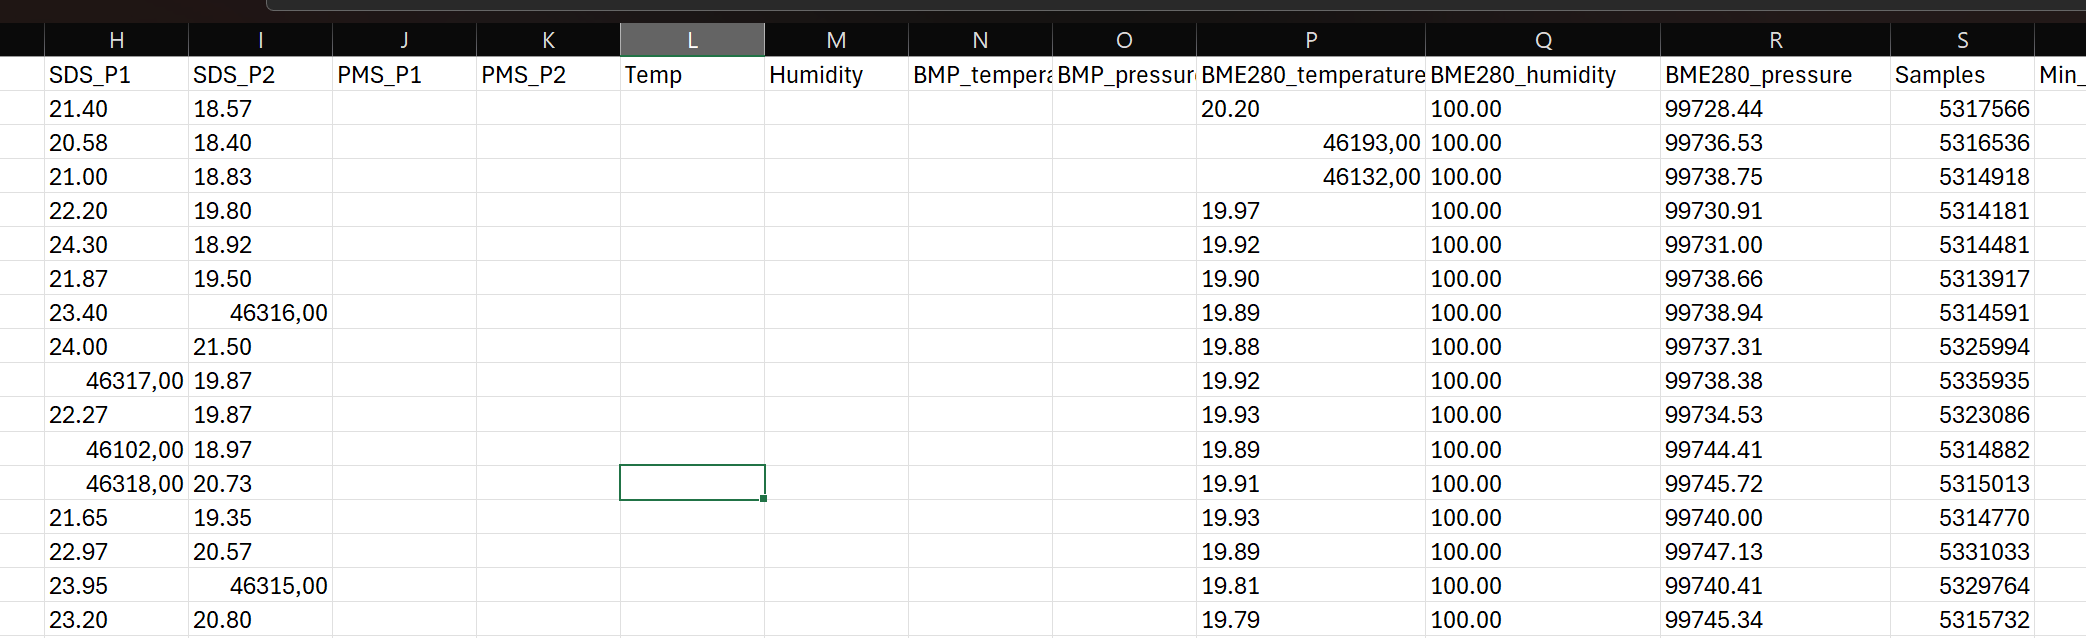
Thanks for the info! I got the files, but I am unsure about the data columns. Is there an explanation somewhere?
What is SDS_P1 and SDS_P2? Why do i sometimes have values such as 46000 for them? I believe that is Excel misinterpreting the delimiter, right? What is samples, Min and Max_cycle?
BME280_pressure: Barometric pressure from BME280 in Pascal 
samples: Number of samples gathered in one iteration
min_micro: minimal time for one iteration in microseconds
max_micro: maximal time for one iteration in microseconds
signal: RSSI value in dBa (Received Signal Strength Indicator i.e. Wi-Fi strength)
Samples, Min and Max micro are firmware statistics that can help with debugging.
It indeed looks like Excel did some mangling of the original data. Note that the CSV-files have a semicolon ‘;’ as field separator and a period ‘.’ as decimal separator. It looks like Excel in your case expects a comma ‘,’ as decimal separator.