Hello,
I am curious why the measured values/readings on the map differs for the EU, WHO and ‘‘normal’’ PM10 and 2.5.
Let’s have a look:
Hello,
I am curious why the measured values/readings on the map differs for the EU, WHO and ‘‘normal’’ PM10 and 2.5.
Let’s have a look:
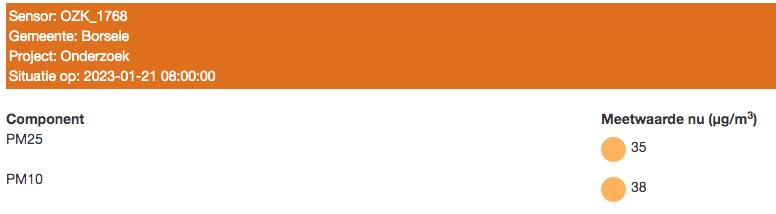
All these readings come from the same sensor/location.
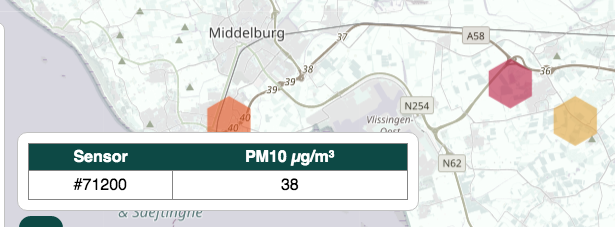
The first image (blue line) shows a reading of 38 µg/m3 which corresponds with ‘‘normal’’ PM10 reading on the second image and also the last (fourth) image (data taken from Samen Meten - Dataportaal).
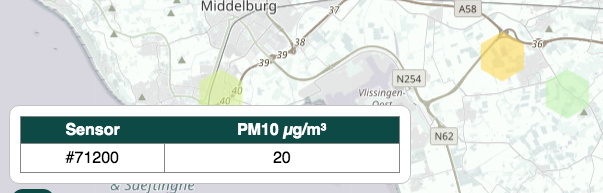
But why is there such a great difference with the ouput for the EU and WHO PM10 readings?
See third image.
I mean it’s the same sensor right? why would the value change? Is there some correction going on according to EU/WHO standards? If so why?
Just curious, hope one could elaborate.
The SC sensors sind live data. Are the others daily or hourly means?
Also live data!
But why is the same SC sensor (#71200) giving 2 different readouts (see image 2 and 3).
The second image is the normal PM10 and the 3rd is WHO/EU.
The normal is 5m readings and the WHO/EU are hourly means correct.
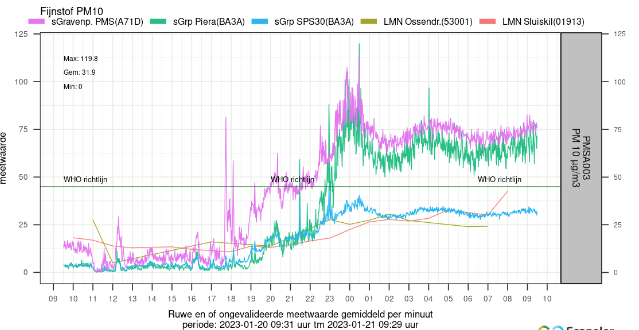
But what i can gather something is off, the readings never came close to 20µg/m3.
Not even below 25µg/m3 over a period of 8 hours (see first image).
@ZLD
The map ( Map Sensor.Community ) sometimes doesn’t load properly the first time you open it. Sometimes there are sensor shown that don’t really exist (there). → Try to open the map and then refresh it right away.
Tell me if that worked…
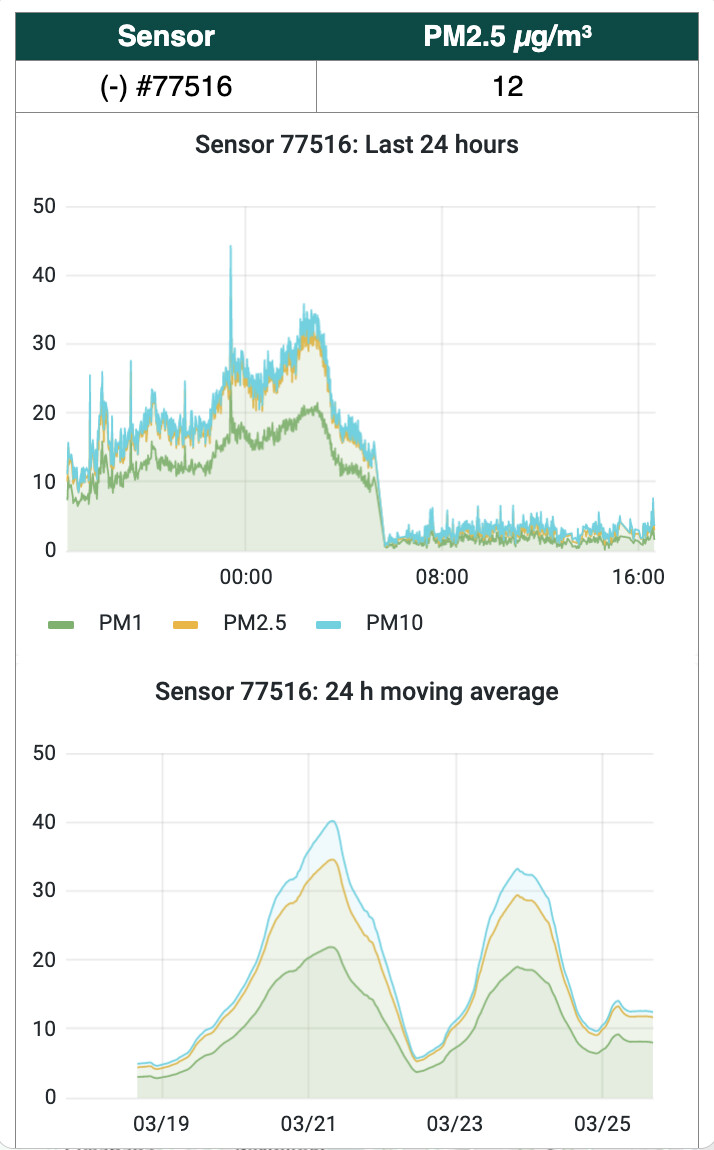
It seems like “EU/WHO 1h mean” actually displays 24h mean rather than 1h. Here is my case:
It shows that “EU 1h mean” equals to 12, but it can’t be 12, as it was less than 10 (or even less than 5) in the last 8-9 hours, as you can see from the top chart.
However if you look at the bottom chart that displays 24h moving average over a week, you’ll see the last values on the right are actually somewhere around 12. And it makes sense looking at the top chart as well: there were higher concentrations last evening/night (>20-30), but on average with low morning/afternoon values, it may well be 12.
I ll check this evening.
Actually you are right…
We will correct.