Hi all,
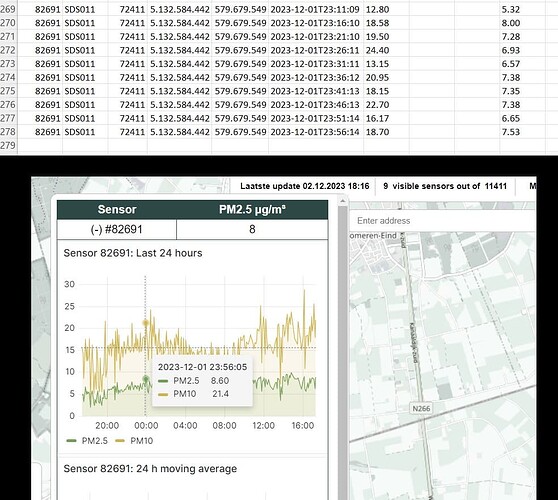
I downloaded the historical data of my pm-sensor to see if i could do some analyses. I noticed differences between the data in the downloaded csv-file, and the data shown on the sensor community map.
For example: the data in the csv-file shows the following data for last measurements of December 1st:
- PM10 at 23:56 = 18.7
- PM25 at 23:56 = 7.53
However, when I look at the data shown on the sensor community map, the values are as follows:
- PM10 at 23:56 = 21.4
- PM25 at 23:56 = 8.60
Does anybody know why there is a difference?
Thanks!
Edwin
