This post is the answer to a similar post as it is not possible to make more than 3 replies to a given post !!!
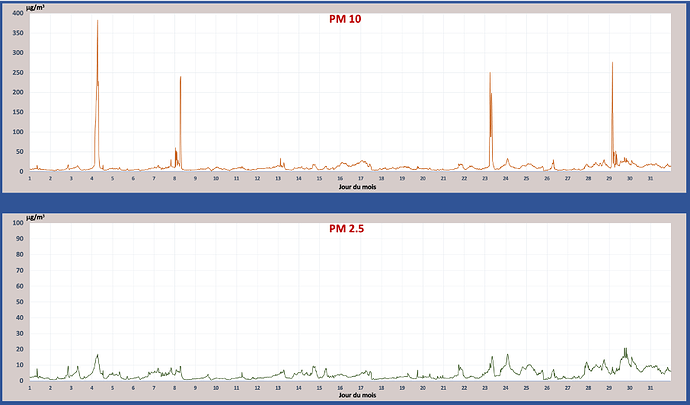
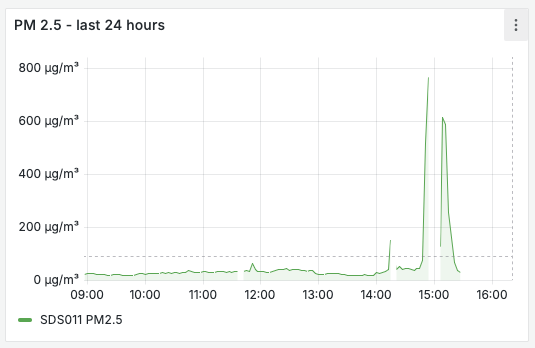
Pending on weather conditions (foggy atmosphere) it may happen that peak measurements are displayed for PM10 and PM2.5: case of the following graph
So you have to limit the maximum value to a more usual value for your processing; 100 is the maximum we should expect is a normal environment (low pollution) either for PM10 or PM2.5. In my processing I cap the peak to 80 for PM10 and 50 for PM2.5.


