Hi,
Would there be a way to graph and corolate one sensor with the surounding sensor average and link that with the direction of the wind to know which direction provide the stronger local deviation.
This would be very usefull to seperate “constant” polution from specific local exposure.
Any suggestion to have that possible on currernt graph would be great?
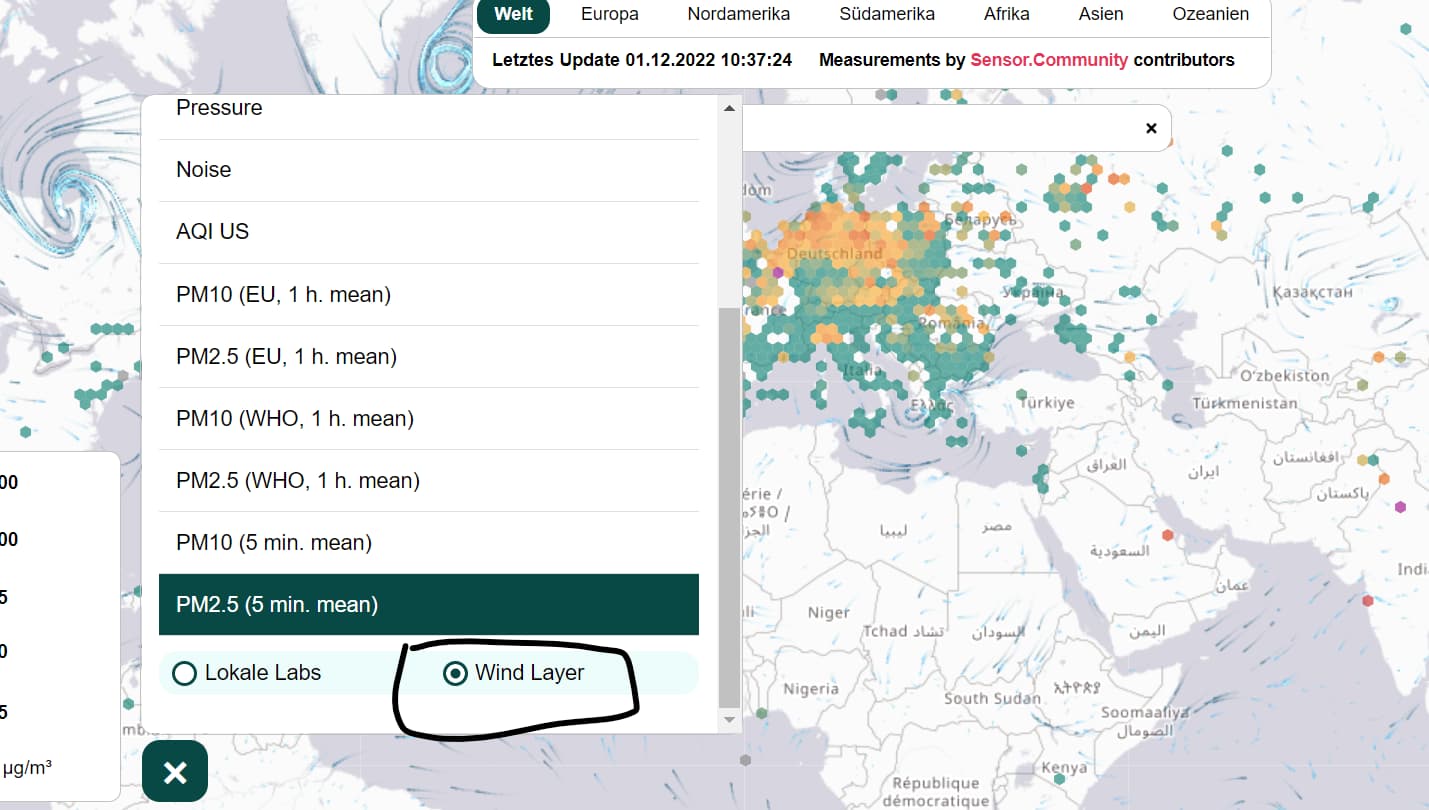
@JC_M, in Map Sensor.Community you can click on the menu to show “wind layer”. You can then see where the wind comes from and from the colour of the hexagons you can see the proof.
Hello,
Thanks for answering. I know about the wind layer. What I meant is to be able to have that information as well together with the PM detailed graph of the sensor. It would be great to have ways to corolate those information to specific source of emission. For exemple if you are expose to a cheminey, it gets possible to show the variation depending if the wind is from one side or the other.
Best regards.
Have periodic average level of pollution depending on the wind direction would give great insight I believe.
1 Like
This R package can probably do what you want.
2 Likes
Yes I think I saw such graphic in openair but you would need a free wind API.
1 Like
Thanks a lot.
Unfortunatly I am not fluent in IT so I can t make it.
I was wondering if some of those rendering possibilities could be added to the site to help understanding the various sources and reason behind poor air quality.
A possibility to get connected and tchat between sensor owners locally or not could also be helpfull.
Thanks.
Those renderings are the paid job of scientists at the local AQ institutions…
The EU privacy law prevents a lot of connection possibilities through SC. Sensors owners should connect themselves here or build some local communities (pins on the map) and organize meetings and operations locally.
Yes I understand.
Fernando @nanocastro has made an online app to download from the sensor.community archive that also uses openair to make some renders, but there is no wind data because as Pierre said that would require access to another source.
2 Likes
Hi
Thanks for responding.
The app is great.
Would it be possible to use entering several devices and graph together.
Regarding wind corelation,
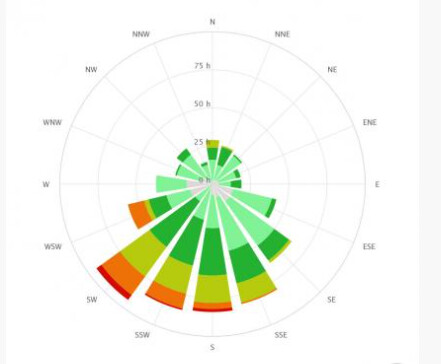
does that type of source could be of help?
Thanks