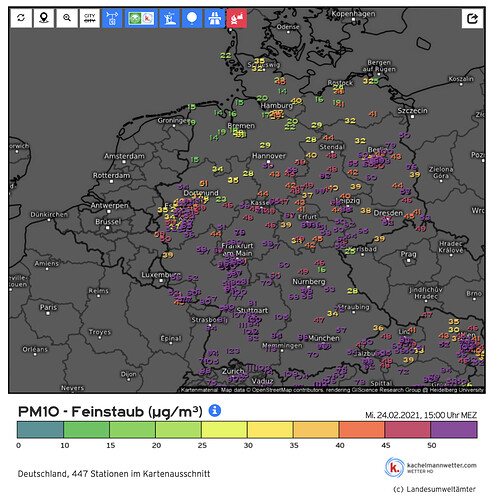
Right now there is a cloud of Sahara dust “raining” down on Germany.
Current measured values from kachelmannwetter
The purple on the legend starts at 50µg/m^3 but typical values are 100µg/m^3 and beyond.
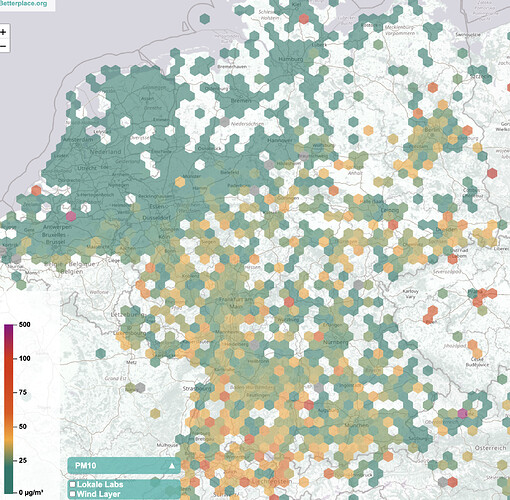
In the meantime our low-cost sensors see the world through their eyes:
The trend is visible but the actual values are far too low.
I just wanted to share that observation because we don’t have these conditions that often.
1 Like
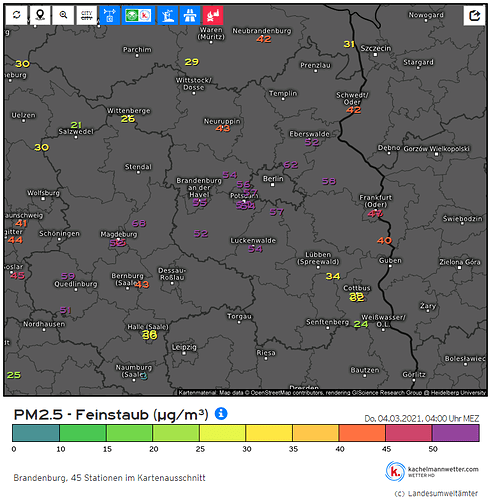
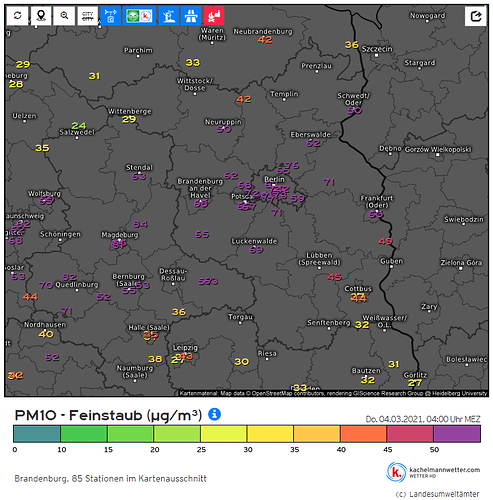
An update: last night the next cloud of dust rained down over the Berlin/Brandenburg area. Peak values at 4am from the official stations:
PM2.5
PM10
At the location of my sensors the expected values should be close to PM2.5 = 57µg/m^3 and PM10 = 71µg/m^3
Here is the data from the airrohr sensor (SDS011 & SPS30)
And here is an SDS011 in the NAM enclosure (with heating)
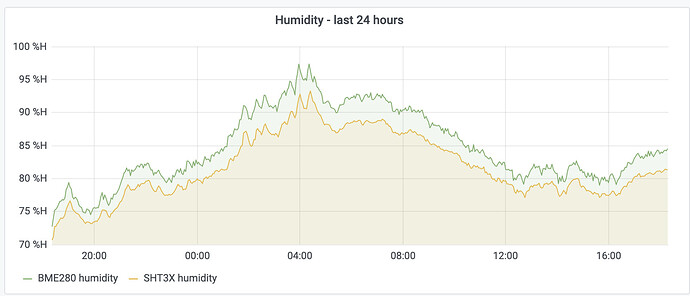
Humidity plot for the same time (SHT35 with SF2 cap and the best BME280 I could find)
I feel this is a really good result and could be an interesting sidenote in the discussion that @Denis and @irukard have in another thread .
Note, that I do not know which SDS011 is currently build into the NAM. I tried several but they are all from end of 2020.
mdmd
March 4, 2021, 3:00pm
3
Thx for showing your data nephilim !
Exactly, and BME280 is green, SHT35 is orange.
EDIT: Fixed the images. The browser I used first is mediocre and does not display the legend. Everything is fine in chrome.
1 Like
